Qualcomm Inc (Long)Qualcomm Inc
Long
Entry at 131.03
Take Profit at 142 (8.32% profit from entry)
Stop loss at 125
1QCOM trade ideas

QCOMThe pressure against money markets has been declined since the actual inf. data is approximating the expected inf. data. Avg cost is 115 usd.
Not an investment reccomendation.

QCOM Week of Jan 23rdNot much of a QCOM trader but these probs were interesting and felt like sharing.
Earnings release coming up in 2 weeks, so be mindful of that.
Overall, the chart looks pretty bullish, imo.
I am long on it, 100 shares and 2 calls (was 5 calls and 150 shares but locked in some profits at market close on Friday). AVG 120.11. TP is that green box.
Save trades everyone!

In a sea of red there still some bulls standing Just talking walk down wall street AKA the HeatMap looking at a sea of red I notice a small pace of green as i zoomed in long behold it was QCOM as i started my top down analysis i seen it was breaking its down trend as i made my way to the daily chart i stumbled upon a Cup & Handle at the neckline looking ready to take off any moment with a measured move of 17 points if it fully play out so that's a very juicy target for trades to pass up !!!!

Qcom 88 gap closeIf you zoom out you'll see a H&S pattern and the wedge I've outlined is the right shoulder ..
Right now we are currently around the neckline of that H&S
I've said this before in my post that unless support is broken on thar right shoulder, it could turn into a wedge; I've learn that lesson the hard way!!.
Qcom has earnings early February. I think between now and earnings we start heading towards that gap close.
Of course there is a major squeeze going on in the market right now but as long as Qcom stays under 130 I like this play.. B+ setup
I'll be buying Feb 17th 100P.. I'll let you know Via tweet when Im in...

Qualcomm play . Hi,
Definitely risky one.
As you can see very wacky chart and price move . over all shooting for 107 area.
Playing this one short by end of the day based on news .
Martch 17 . 100 Puts .

QCOM Classic Bear Flag breakdownTextbook continuation pattern playing out. Prior break on weak earnings was quickly brought back into the channel where it has remained. Continuing this downside break sets to target 94 to fill an old gap left behind

Below RectangleTriple top/Price is now below a short lived rectangle. I am watching this one as it is a keeper at the right price for my portfolio.
I hear this blonde (Stephanie) chick talk about fundamentals on CNBC continuously. She has it down pat and can quote every PE ratio in the universe as well future, past and present earnings! She says "5, 6, 7, times future earnings" a lot. Does it matter if the sector or the market is not moving???
1-2-23/engulfing/bearish )o: She recommends buying it right now due to the fundamentals. I like the fundamentals as well! But is it time to buy it? Dunno.
Securities can have fantastic fundamentals. Where do these gr8 fundamentals get me if the sector is not moving in my direction? My answer is nowhere.
I suppose there are fundamental analysts and technical analysts and I guess it is not unusual for the 2 to disagree. I look at fundamentals, but the actual chart drives my decision,
I am not saying either is right or wrong. I am just saying we are all different and that is what makes the world go round (o:
No recommendation except be patient.

Price is Below a Symmetrical TrianglePrice is below the triangle.
Doji of indecision today and a spinning top yesterday.
Earnings miss for QCOM and not only was it at the resistance line of the triangle when the drop took place, price was also at the upper trendline of a channel down so perhaps a double whammy.
It is getting harder and harder to draw trendlines as the channels down are aging somewhat.
I see 2 channels but you may see it differently.
I drew the trendlines on a weekly time frame.
No recommendation.
Strong stock but in a bad place )o:
I have noted as of late, that when price breaks down from a symmetrical triangle, it is often a deep break.
Qcom short off the 200sma and GP Qcom short off the 200sma and GP
The stop loss goes above the GP and POC TP will be bottom of the channel.

$QCOM with a Bearish outlook following its earnings #Stocks The PEAD projected a Bearish outlook for $QCOM after a Negative Under reaction following its earnings release placing the stock in drift D with an expected accuracy of 60%.

QCOM // Wedge indicatorFibonacci targets should be followed provided that it closes above the wedge indicator.
Time to be bullish again on Qualcomm?For now this looks like a bullish retest of this triangle structure but obviously if we lose the weekly moving average as support we could go down to the bottom of the big multi year fib channel at approximately 115$ or even the pink moving average which is sitting at about 100$ which is the previous dot com bubble all time high. I consider these 2 areas very strong support, honestly I doubt Qualcomm will reach these targets as this company has very strong finances and technology. There seems to be a lot of demand at the 125$ level as well.
As we can see with the weekly Heikin Ashi candles the trend still appears to be to the downside but the last 2 candles are looking a lot more bullish than the ones before that.
I bought more shares today and will add more if it drops to these targets. Good luck with your trades guys!

QCOM daily pinnacle pattern consolidationOrder BUY QCOM NASDAQ.NMS Stop 116.64 LMT 116.64 will be automatically canceled at 20230401 01:00:00 EST
QCOM daily pinnacle pattern if we break above can expect C wave ABC correction up.


Qualcomm (QCOM) bearish scenario:The technical figure Descending Triangle can be found in the daily chart in the US company Qualcomm (QCOM). Qualcomm is an American multinational corporation. It creates semiconductors, software, and services related to wireless technology. It owns patents critical to the 5G, 4G, CDMA2000, TD-SCDMA and WCDMA mobile communications standards. The Descending Triangle broke through the support line on 30/09/2022. If the price holds below this level, you can have a possible bearish price movement with a forecast for the next 80 days towards 98.71 USD. Your stop-loss order, according to experts, should be placed at 152.81 USD if you decide to enter this position.
Looking at its valuation, Qualcomm is holding a Forward P/E ratio of 9.6. For comparison, its industry has an average Forward P/E of 17.45, which means Qualcomm is trading at a discount to the group.
It is also worth noting that QCOM currently has a PEG ratio of 0.61. This metric is used similarly to the famous P/E ratio, but the PEG ratio also takes into account the stock's expected earnings growth rate. QCOM's industry had an average PEG ratio of 1.81 as of yesterday's close.
Risk Disclosure: Trading Foreign Exchange (Forex) and Contracts of Difference (CFD's) carries a high level of risk. By registering and signing up, any client affirms their understanding of their own personal accountability for all transactions performed within their account and recognizes the risks associated with trading on such markets and on such sites. Furthermore, one understands that the company carries zero influence over transactions, markets, and trading signals, therefore, cannot be held liable nor guarantee any profits or losses.

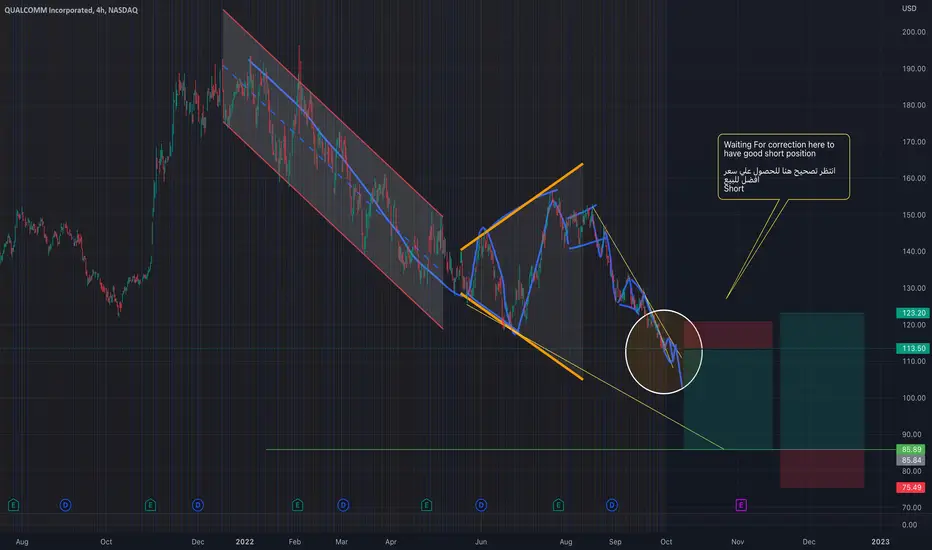
QCOM Head and shoulders patternhello,
QCOM
I see Head and shoulders pattern with target around $85, also Waves analysis there is we are in correction (daily) with target about $85 also, I will wait good price may be (117) to short
not financial advice DYOR
Bullish on Qualcomm. QCOMBetting on in the position of the B Wave in this pretty epic zigzag. Taking retrace of ?B of B for targets of C. C's within triangle tend to be the largest of the lot, so a chance we may come back to this idea and extend the goals to hyperextension incase of an epic C at a later stage.
We are not in the business of getting every prediction right, no one ever does and that is not the aim of the game. The Fibonacci targets are highlighted in purple with invalidation in red. Confirmation level, where relevant, is a pink dotted, finite line. Fibonacci goals, it is prudent to suggest, are nothing more than mere fractally evident and therefore statistically likely levels that the market will go to. Having said that, the market will always do what it wants and always has a mind of its own. Therefore, none of this is financial advice, so do your own research and rely only on your own analysis. Trading is a true one man sport. Good luck out there and stay safe.

Mega short?Looks impossible, especially for semiconductors....
This is a log scale (btw, recommended for the long-term charts).
Just in case))
Trade and invest safe

QCOM swing long ideaHey all,
I am feeling near-term bullish(FOR A BOUNCE), and I noticed that QCOM is at a key support level right now. I expect the level to hold; here is my trade idea.

QCOM BUYQcom is retesting the 124 support line. It has been here for the past 2 years and has rebounded every time.

#QCOM Long IdeaHello dear Traders,
Here is my idea for #QCOM
Price finds support at monthly pivot S1 line.
As long as the price is above support zone, we will wait for a close above the yellow trigger line in the 4h chart to enter the trade.
Please feel free to ask any question in comments. I will try to answer all! Thank you.

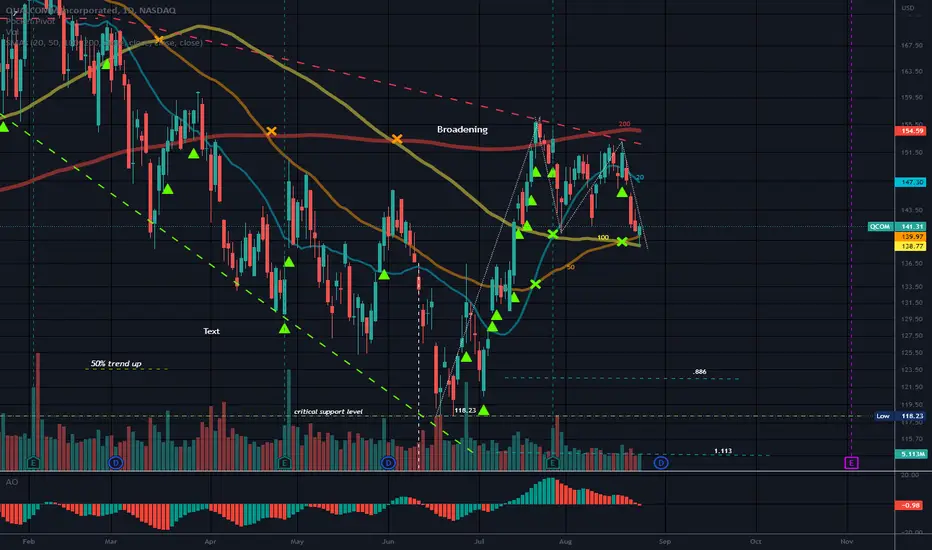
Broadening PatternMixed signals for now.
There are some recent positive moving average crossovers but the top trendline of an apparent broadening megaphone like pattern, appears to be giving QCOM some issues.
The moving averages are still out of order with the 200 on top versus the bottom of the group. It is not sloping down and is the longest term moving average on the chart.
Price is hanging on the 50 DMA.
The 20 looks droopy.
I am not sure this will be able to get past that descending top trendline in a timely manner but time will tell.
Possible M forming that would take this down a notch or 2 or even 3.
It is early to be guessing at what is forming, so I will not.
There is an unfilled gap overhead.
I like this stock and plan to watch it.
No recommendation. Be safe.
I thought the government bailed out this industry so all would be hunky dory. Well I guess we bailed it out because the government does not generate revenue I guess.
I guess we are paying for my unemployed next door neighbor's horticulture master's degree too. She plants a lot of tomato's in her back yard and owes a ton in student loans. She does give me a tomato sometimes though. (o:
If you can not spot the fool when you sit down at the poker table, it might be you.