Following the Crypto TrendDepending on how it all plays out with bitcoin we could see history repeat itself in a big way shortly. aligning with the macro theory that 2026 will be profitable for a majority of traaders, giving the global 2-3 years to get used to higher interest rates markets should settly and head towards new highs as long as nothing too unpredictable happens. following that narative all of these btc mining companies, as long as their in line with developmental goals, should reap the rewards. just spitballing here nothing too serious
1RIOT trade ideas
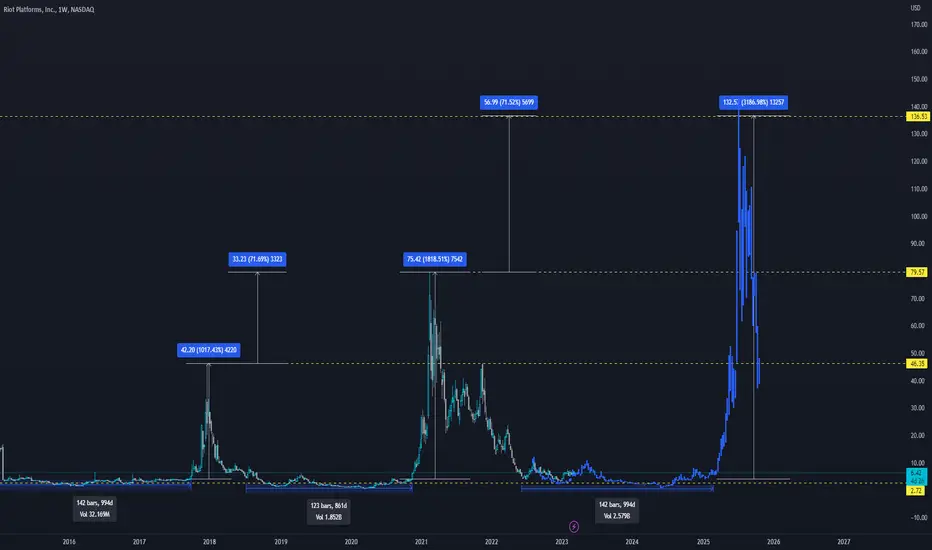
RIOT - Buckle UpRIOT is about to take off - which direction is not entirely clear atm, but IMO up is the way. BBs are getting tight and horizontal and there has been a bunch of price action at this region... GLTA!

RIOT Blockchain vs CoinbaseSimple comparison of RIOT Blockchain to Coinbase. Both will do well but it does matter what which one you are holding at certain times of the cycle.

RIOT - Adam and Eve pattern in the making?RIOT appears to be forming an Adam and Eve pattern (8 months in the making now) with the stock flirting with the 200 day moving average since 30 Jan this year.
What is worth noting was its volume pattern since the start of this year: higher volume up days (accumulation) vs lower volume down days (distributions). A tell tale sign that the stock is probably on investors' radar rather than shortists' at current prices.
While it is tempting to long the stock at current levels, there is still risk that the stock could continue to trade sideways for a (long) while more. I would probably wait for a break above 7.78 (neckline 1) to initiate some long positions. Even so, be mindful of headwinds @ 8.67 (neckline 2) and then @ 10.52 (neckline 3).
However, should the stock be able to clear above 10.52 eventually, then it is a stronger signal that uptrend is underway (volatility not withstanding).
p/s buy the dips is also a good strategy once an uptrend is established.
Disclaimer: Just my 2 cents and not a trade advice. Kindly do your own due diligence and trade according to your own risk tolerance and don't forget that money management is important! Take care and Good Luck!

Riot looking great right now, anticipated high of $80 ++Riot looking great right now, anticipated high of $80 ++, now it is at 6.59 as i write this review, the Fibonacci circles are indicating a high of at least 80 in the next bitcoin run. Next level would be 337 for riot if Bitcoin goes to the higher levels of $200,000 to 418,000. This update is for entertainment purposes, should you require financial advise, seek out a professional. Thanks.

RIOT - Quarterly Outlook - For the DreamerZZZJust candles for simplicity... Still needs to close March (and the quarter) with a bullish posture (ideally a bullish engulfing) - if it does, then this become more probable... currently for the dreamerzzz, but has the look atm... I get a clean 5 waves off the lows... GLTA!

small retracement then we head towards 10small retracement to about 6.77- current price then we rally towards 8.50, after a small retracement from there we should see $10 as our next major level within a week or so


Invers HSI believe if BTC rise, Riot will rise as well. As you can see on the chart that the right shoulder is forming at the moment.
TP1:10.50
TP2: 17.30
Obviously its only my idea, not financial advise.

RIOT at extreme support, move higher expected🤖I expect to see the 3rd big bounce from this support zone in the near future, potential for 1000%+ in returns is possible! it may take a while though.
stop loss below supports and targeting 24.01-40.97-54.70


lets get a RIOT goinglets get a RIOT going - I see $8.22 very soon once we get past this comical "fake" double top ;)


RIOT Blockchain: Bearish Divergence Double TopRIOT has Hidden Bearish Divergence ont e MACD and Classic Bearish Divergence on the RSI and I will be playing this via the March Puts at the strike of $5.5.


Going to Start another RIOT?Looks like this will be 50% cheaper shortly. Buckley up boys get ready for the recession.

RIOT Long Term Fib & VWAP Although both charts look identical, RIOT is further on its retracement journey in comparison to MARA. Watch for the leg lower on BTCUSD to fuel a leg lower for RIOT and MARA.

RIOT Levelnot using SMC for this for anything more than a reference. red is suspected trend start for the current uptrend on the retest. so on the first test should get a decent reaction. i suppose this should continue to push upwards after retracing this entire trend to find a new high, or clear out the current swing high at the very least. suspect this moves with crypto whenver that starts to move agian, woudld be decent exposure
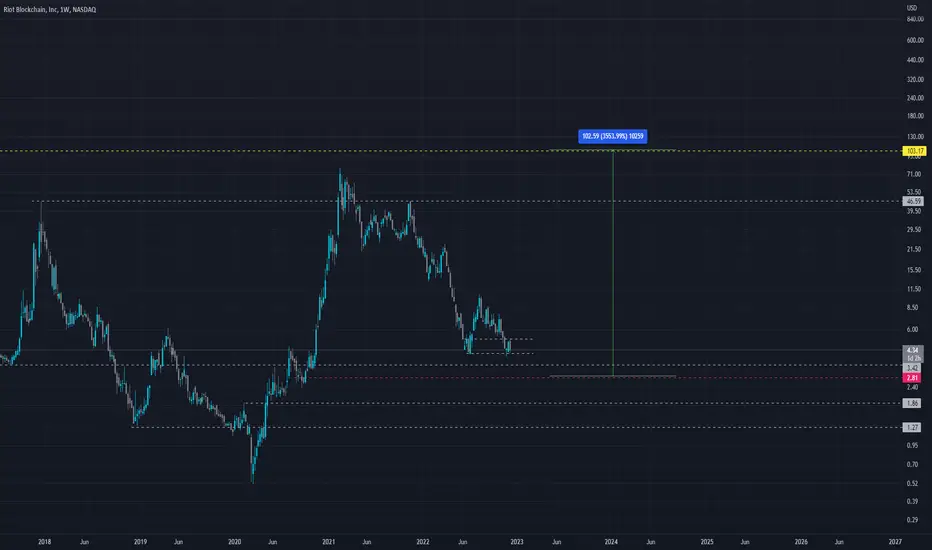
RIOT monthly despair zone of bubble cycleRIOT monthly despair zone of bubble cycle. If this thing survives it will go up after crypto ice age is over )))

Graphical and Fundamental Analysis of Riot Blockchain (RIOT)1. Graphic Analysis
The price has broken a diagonal support at the white line.
If going to bet on a rise, I would expect a bear trap at $4.
If the downtrend continues, the next targets will be hit on the Fibonacci projection.
$1.30 would be the longer target.
The indicator at the bottom demonstrates the correlation with the price of Bitcoin, which is positive.
The macro scenario remains bad, largely due to the FTX crash.
The quarterly results presented by blockchain and mining companies are being released, and by the way, they are not good.
The question is: if the next results are not positive or if more companies fail, to what extent this would affect Bitcoin and other cryptocurrencies.
2. Fundamental Analysis

RIOT BREAKOUT FROM DOWNTRENDI am taking a position in RIOT, it clearly broke out from the downtrend channel and is positioned for growth.
Looks like heathy bull flag with C&H forming.
BTC looks like it will finally push higher, at least in short term.
Market is general is bouncing as well.
My first target is 8.47
Good luck!

RIOT Blockchain - Smart Money ConceptsSimple theory at work here. Buy the discount, sell equilibrium. as straightforwad as it gets, should play in line w btc to see a huge wick down back into that area shortly before moon. ggs
