ROCKET LAB on an accumulation zone, +100% profit potential.Rocket Lab (RKLB) just formed a Death Cross on the 1D time-frame, almost a full month after rebounding near the 1.5 year Support Zone. This is technically an Accumulation Zone that the stock tends to make on that Support Zone before starting a parabolic Rally to the Higher Highs trend-line.
In fact it was the 1D Death Cross formed on March 15 2023 that started the previous Accumulation Phase, which resulted into a +114.46% really. As a result, we expect this Phase to last until the end of March maximum, and then start a parabolic rally. Assuming each rally is by +10% stronger than the previous (1st +105.08%, 2nd 114.46%) then we estimate the next one to be around +125%. This will make a perfect test of the 8.75 April 21 2022 High.
Notice how each rally peak is very efficiently depicted by the tops of the Sine Waves. Also during each Accumulation Phase, the 1D RSI forms a Bullish Divergence on Higher Lows.
-------------------------------------------------------------------------------
** Please LIKE 👍, FOLLOW ✅, SHARE 🙌 and COMMENT ✍ if you enjoy this idea! Also share your ideas and charts in the comments section below! This is best way to keep it relevant, support us, keep the content here free and allow the idea to reach as many people as possible. **
-------------------------------------------------------------------------------
💸💸💸💸💸💸
👇 👇 👇 👇 👇 👇
1RKLB trade ideas

Updated long term Idea RklbAn update on my long term movement idea with Rklb, it's just my theory after noticing the head and shoulders pattern on the daily and how things have been playing out with lower highs and lower lows to this point. I've listed on my chart what I think are some possible key areas of support and resistance. Again this is just my two cents on some next plays needing to play out before seeing some upward movement for bigger moves in the long run. I'd still anticipate some downward movement in the short term.

Rklb mid to long term movement idea for $8.05 rangePatiently waiting for a breakout to happen, if so I believe over the mid to long run, we should see things touch the $8.05 range, this is my price prediction.
www.tradingview.com

Climb the mountainPrice are defining a new channelup that probably will bring back to 5$ to the end of the month
Earnings on Feb 27 can change the plan pushing higher
I'm still bullish on Rocket Lab

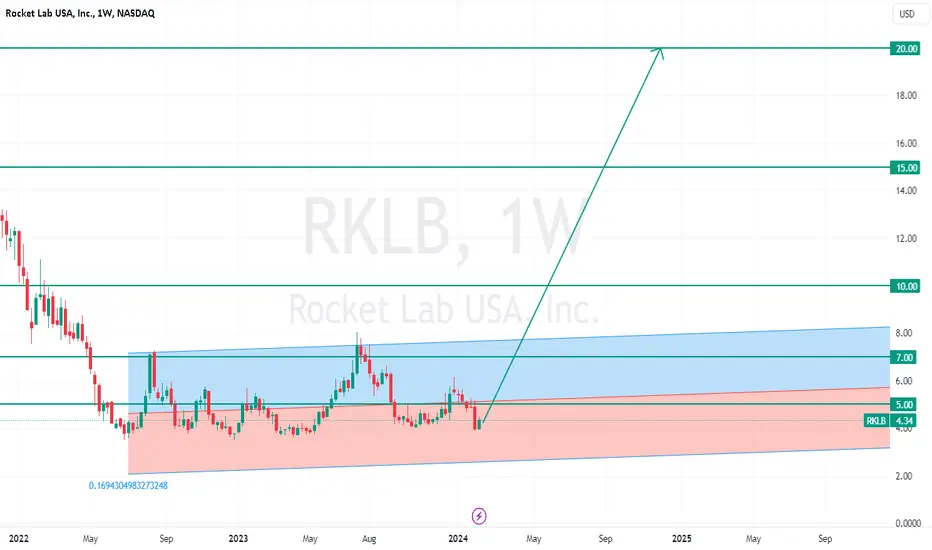
Rocket Lab USA - RKLB - Ready for upside movement Rocket Lab USA, INC RKLB CMP - $4.33 / Positional Trade
Buy Range $4.30 - $4.40 / Strict Stop Loss $3.45
Target 1 - $5
Target 2 - $7
Target 3 - $10
Target 4 - $15
Target 5 - $20
Disclaimer: This is my view and for educational purpose only.
$RKLB Potential OutlookSimilar to what it has done in the past, I believe it could create a very similar pattern. The one caveat is the M&A (Merger & Acquistion) news that is pending from their latest convertible note raise.

$RKLB - Can we launch?NASDAQ:RKLB Rocket Lab's prior setups were destroyed by the news of the convertible debt offering. We are now working with a new triangle setup.
The stock bounced from the lower trendline and is currently trading at the Point of Control (POC) volume resistance. The price needs to climb above $4.50 to clear the volume resistance.
Closing above $5.50 will validate the triangle breakout, potentially launching the stock higher to the $7.50 area.
The only things that can destroy this setup are a launch failure or Peter selling millions of shares again.
Upside targets:
$5
$5.50 (major resistance)
$6
$7.50
Downside risk:
$3.50

GroundedBad Bad news about private placement will hurt a lot
Triangle breaked downward and price will probably reach bottom of weekly chart today around 4.20$
I think price will then start to rise again quickly
Symmetrical triangle compressionRocket Lab ready to explode
Price compressing inside a symmetrical triangle
I suppose a strong upside move will soon happen

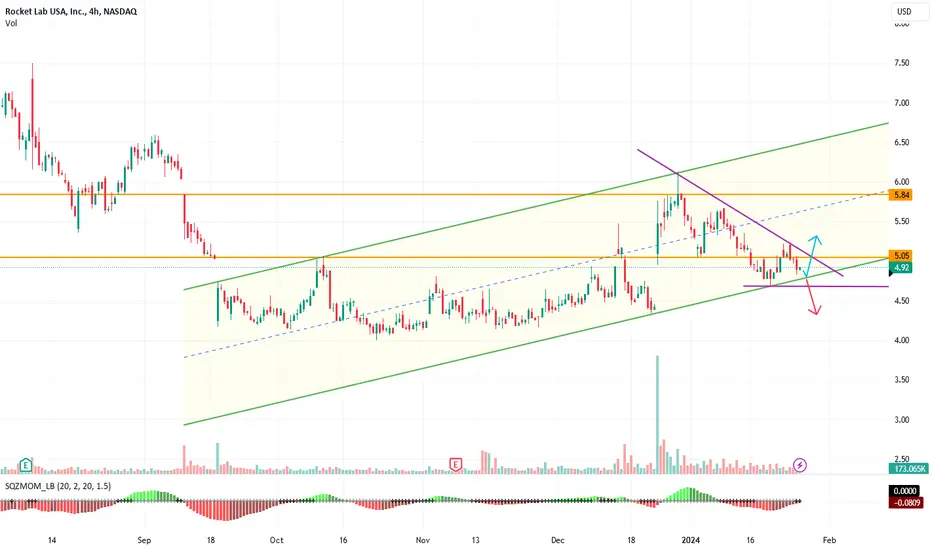
Bounce incomingI think today price will bounce around 4,80$ to start a new upside movement
Closing over trendline at 5.06$ confirm bullish trend will continue
Closing below 4.68$ bullish trend will end
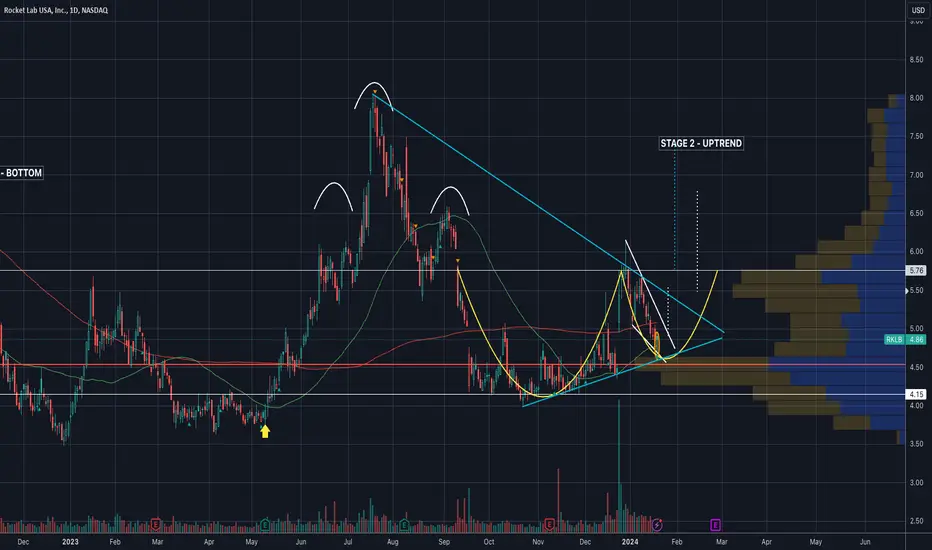
$RKLB - Can we see a turn?NASDAQ:RKLB Rocket Lab printed a hammer on Friday and closed above the 50DMA and a Fib, signaling a potential bottom.
In the near term, the stock is trading inside a descending wedge, and a breakout could send the stock to $5.50.
On the longer-term timeframe, the stock is trading inside a triangle with the cup and handle pattern, with a projected measured move of $7.50.
In a bearish scenario, I don't think the stock can go down below the $4.60 to $4.50 area, barring catastrophic events such as a launch failure, war, etc.
Upside targets:
$5.50
$6.80
$7.50
Downside risk:
$4.50
I post detailed technical analysis of stocks with targets. If you find my analysis helpful, follow me for more posts like this.
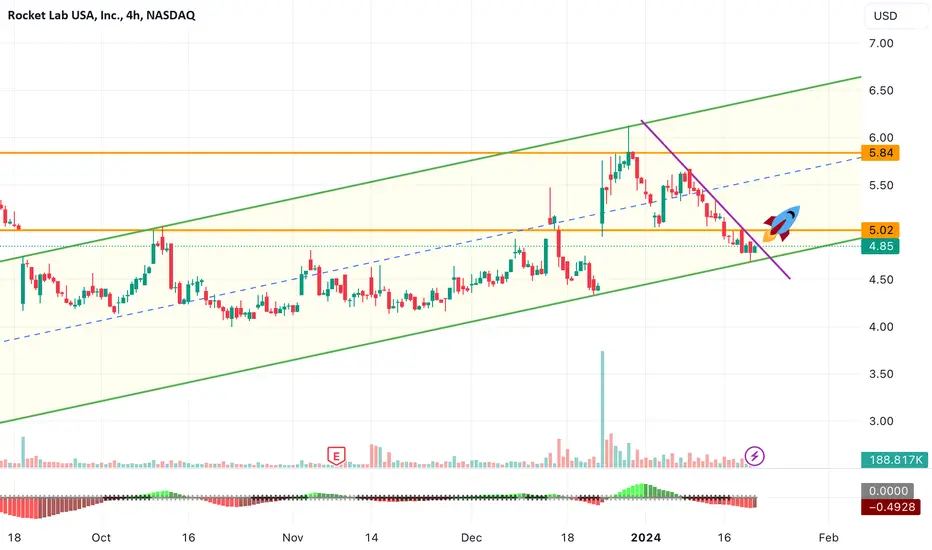
Breakout incomingRocket lab was on sell for many days..
I think it reached the bottom and is now ready to breakout descending purple line and start a new bullish trend
Confirmation closing a 4H candle over 5.02$
$RKLB - Get your dry powder readyNASDAQ:RKLB Looks like I am going have to get my dry powder ready. Looking like it is heading for the $4.60 to $4.50.
It is basically close to wiping out all the gains from $550 million government contract announcement.
Sometimes, I just don't understand the negativity on this stock.

RKLB Descending Triangle Breakout - SHORTRKLB looking weak after launch run, descending triangle pattern forming and just broke out below triangle support, target $4.00

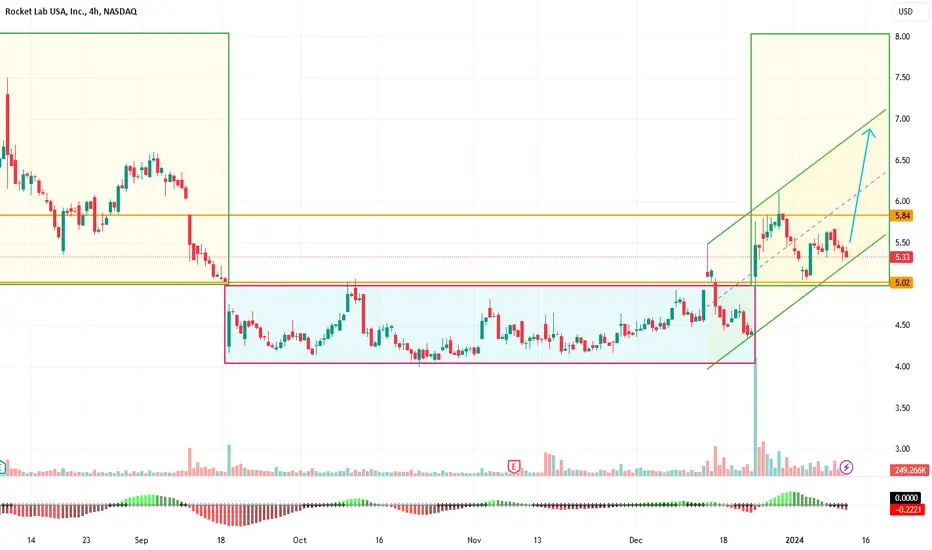
Rocket Lab island reversal and bullish channel upRocket Lab complete an island reversal pattern and then started an upside trend channel
I suppose a new bullish move will start very soon !
$RKLB Hitting FloorRKLB is holding onto $5.16 and if it breaches below, we could see the $3s again over the next few weeks. If it holds onto support, we should retest $6.15 and form a stronger base.

Rocket Lab in upside channelRocket Lab getting more bullish yesterday with SMA200 support and moving inside a raising channel

🚀 Rocket Lab (RKLB) 🚀 Rocket Lab (RKLB) achieved ten successful launches in 2023 and secured a $515 million US government contract, leading to a 22% surge in shares.
The company's success contributes to a 40% increase in shares this year, maintaining a bullish sentiment with an upside target of $7.50-$8.00 and support at $4.00-$4.10. 📈🛰️
#RKLB #StockMarket

$RKLB Support and Buying Opportunities Rocket Lab USA has broken through the ceiling of a falling trend channel in the medium long term. This indicates a slower falling rate initially, or the start of a more horizontal development.
The price has reacted back after the break of the rectangle formation. There is support around $5.14, which now indicates good buying opportunities. An established break through this support will neutralize the positive signal.
NASDAQ:RKLB is approaching resistance at 5.60 dollar, which may give a negative reaction. However, a break upwards through 5.60 dollar will be a positive signal.

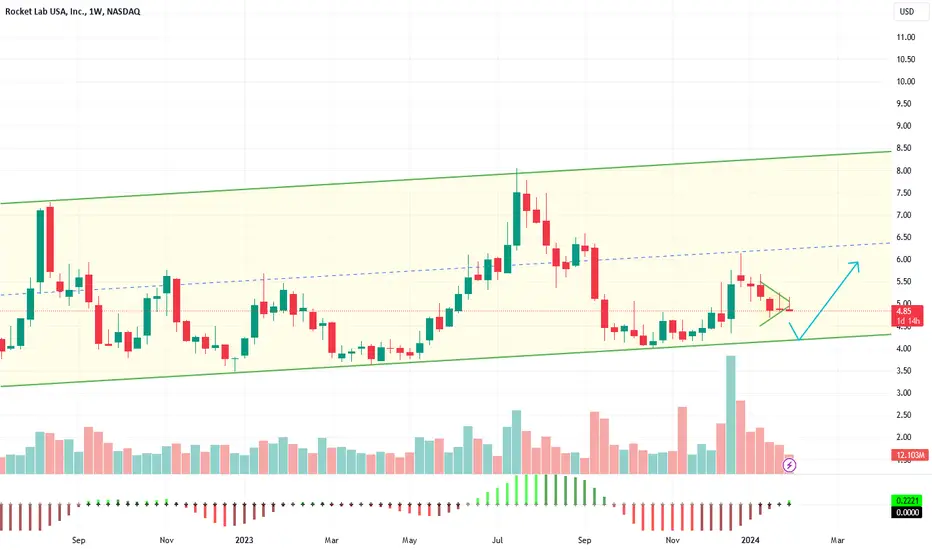
Long RKLBObserving this weekly timeframe alongside a four hour timeframe, there has been a strong accumulation around this price range. This may be a good time to enter LONG, calling for a bullish trend upon us. After being down for consecutive months since July and the consistent insider selling its being bought up around the lower $4 range. Itll have to break resistance around 5.22, beyond that would be 6.60 and finally my price target of 7.79.
on the left side on the four hourtime frame ive added a volume weight average price indicator suggesting the bullish green candles are backed with good amount of buyers.
on the right side we've gotten 3 consecutive green days or bullish candles buyers have deemed this price range cheap and a potential moment in time for the price to break out.

$RKLB - WTF?BOZZ stock update: NASDAQ:RKLB
Ouch! Let's get real. How many of you expected to wake up, see the stock in the red, and then watch it close the day down nearly 11%?
This, after a successful rocket launch, Powell's pivot, and a flood of great economic news?
It's a bizarre failure-to-launch case.
The company trades like a garbage stock so pungent that everyone steers clear of it.
So, what happened? My theory: opex + day trader short frenzy. This stock is a day trader's short dream. You can genuinely drive the stock down and squash any momentum it has with about 50K to 100K shares. Why? Because it has a large float with disproportionately low average daily volume.
Technically, you can see that since the stock broke below 200DMA, it has struggled to get above it. Thanks Peter. The moment it breaches or nears 200DMA, a hard rejection slams it down. Rejections are so hard that you could even develop PTSD from them.
The accumulation distribution nosedives after today's sucker punch breakdown. Luckily, the POC support came into play; otherwise, it would have been worse.
What could happen next? Well, I think the stock might attempt to launch from the POC area and strive to get above that 200DMA. The catalyst? Maybe fund managers and retail traders who missed this bull run, looking around for a decent company left behind in the dumpster in this bull run? I don't know. 🤷🏻
The price targets from the Dec 2 post still stand. I still anticipate reaching $6.50 in the medium term.
But in the meantime, $5 to $5.50 is going to be a pain in the butt. So enjoy the pain. 😮💨
@Peter_J_Beck, I love you but you better not be selling the stock again. 😡

$RKLB - An updateUpdate to the November 11 Post: NASDAQ:RKLB
Rocket Lab is currently trading within a symmetrical triangle, consistently testing the upper trendline. Both RSI and MACD indicators continue to exhibit bullish divergence. Notably, the accumulation distribution is at an all-time low, even as the price remains flat.
The accumulation distribution is currently lower than when Rocket Lab was trading at $3.50. In recent days, it has started to curl up, suggesting that selling pressure may be easing.
While the stock may experience an uptick leading up to the December 13th launch, the market appears to be awaiting this event to determine the next direction for the stock.
Upside targets:
$5
$5.50 (strong resistance)
$6.50
Downside risk:
$3.50

ROCKET LAB can give +100% return. Best stock opportunity now?Rocket Lab USD (RKLB) has been consolidating for exactly one month (blue Arc pattern) after touching the Higher Lows Zone and now uses the 1D MA50 (blue trend-line) as its Pivot. We can see the very same consolidation pattern during the previous two market Lows (April - May 2023, June - July 2022), which gave enormous rallies of +114.46% and +105.08% respectively.
Similar with today's pattern, each bottom was priced on a 1D RSI Higher Lows sequence, which is a major Bullish Divergence. As a result we consider this one of the best high cap stock buy opportunities at the moment, and aim for at least a +105.08% rise, targeting $8.20.
-------------------------------------------------------------------------------
** Please LIKE 👍, FOLLOW ✅, SHARE 🙌 and COMMENT ✍ if you enjoy this idea! Also share your ideas and charts in the comments section below! This is best way to keep it relevant, support us, keep the content here free and allow the idea to reach as many people as possible. **
-------------------------------------------------------------------------------
💸💸💸💸💸💸
👇 👇 👇 👇 👇 👇
