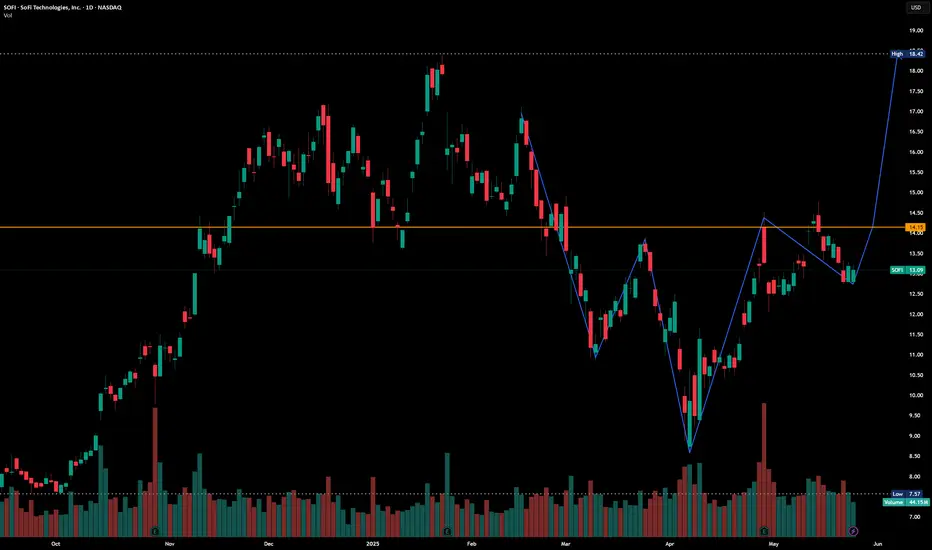
SOFI Long Setup – 2.83 Risk/RewardSOFI looks ready for a breakout. The price is consolidating just above the cloud after reclaiming the Kijun line. This setup offers solid upside if momentum follows through.
Entry: ~$13.46
Target: $16.37 (21.6% upside)
Stop: $12.43 (7.65% downside)
Risk/Reward: 2.83
Why I like this trade:
Clear su
Next report date
—
Report period
—
EPS estimate
—
Revenue estimate
—
0.402 EUR
481.70 M EUR
3.64 B EUR
1.08 B
About SoFi Technologies, Inc.
Sector
Industry
CEO
Anthony J. Noto
Website
Headquarters
San Francisco
Founded
2011
FIGI
BBG01TNWYCM1
SoFi Technologies, Inc. is a financial service platform, which engages in the provision of student loan refinancing options to the private student loan market. It operates through the following segments: Lending, Technology Platform, and Financial Services. The Lending segment offers personal loans, student loans, home loan products, and related servicing activities. The Technology Platform segment focuses on technology products and solutions revenue. The Financial Services segment includes the SoFi Money product, SoFi Invest product, SoFi Credit Card product, SoFi Relay personal finance management product, and other financial services such as lead generation and content for other financial services institutions. The company was founded in 2011 and is headquartered in San Francisco, CA.

SOFI Charts are interesting.. SOFI is in making of Inverted head and Shoulder pattern. Current market Price is nearly $13. If cross $14.90 and sustain , it may got to $18 and $20.
$SOFICurrent Fib setup is set to a template recommended for beginners so that buy zone is a bit broad. Technically broke the uptrend that is started on in mid march.
I do expect more pull back but as soon as there is confirmation of trend reversal and we are back in an uptrend time to take Calls on $SO

SOFI Bullish Setup Above $13.50 Targeting $17.50SOFI is showing strength above the $13.50 level after bouncing off the middle Bollinger Band. Increasing volume and early MACD recovery suggest a potential continuation toward the next resistance at $17.50.
Trade Setup:
• Entry Zone: $13.50 - $13.80
• First Target: $15.50
• Second Target: $17.50

The Flag Will Price break down of the flag below to the 200 EMA in orange (12.15) or will price have a bullish break out of the bull flag pattern and out of the flip zone (in grey) to the 14.50 resistance. Even though price broke out of a parallel channel, it hit resistance around the 161.80% of the Fibonacc

Buckle up. We are on the trampoline. PT 16Looks like the 48 hour sell off on news and short squeeze. Options volatility crush in play. look for rebound to the upside at these levels. downside price 12.50 risk. Upside out 15, 16.

Sofi pull back short flush. Trade to upside. 16 PT 12.5 RiskIt appeared that this sell off is a systematic volatility take profit and short attack. Looking to enter a trade here. Consider taking profit at 15.5- 16.

Fintech's Hidden Strength Positioning for Breakout Rally Current Price: $13.18
Direction: LONG
Targets:
- T1 = $13.80
- T2 = $14.30
Stop Levels:
- S1 = $12.75
- S2 = $12.20
**Wisdom of Professional Traders:**
This analysis synthesizes insights from thousands of professional traders and market experts, leveraging collective intelligen

Supply ZoneSOFI is still facing resistance at the top of a parallel channel, and consolidating. It fought a supply zone and fail on April 29. SOFI need to clear 13.80 with some bullish candles and volume to *hopefully* start and uptrend.

$SOFI earnings TuesdayNASDAQ:SOFI earnings Tuesday morning! 4 straight quarters of profitability is inbound and bears won’t be able to see @SoFi as an unprofitable company anymore. 180m shares that have been sold short are now officially underwater.
Q3 Estimate
Members: 715,000k
Products: 1.1m
Revenue: $650m
EPS: $0.

See all ideas
Summarizing what the indicators are suggesting.
Neutral
SellBuy
Strong sellStrong buy
Strong sellSellNeutralBuyStrong buy
Neutral
SellBuy
Strong sellStrong buy
Strong sellSellNeutralBuyStrong buy
Neutral
SellBuy
Strong sellStrong buy
Strong sellSellNeutralBuyStrong buy
An aggregate view of professional's ratings.
Neutral
SellBuy
Strong sellStrong buy
Strong sellSellNeutralBuyStrong buy
Neutral
SellBuy
Strong sellStrong buy
Strong sellSellNeutralBuyStrong buy
Neutral
SellBuy
Strong sellStrong buy
Strong sellSellNeutralBuyStrong buy
US83406FAA0
SOFI TECH. 21/26 ZO CVYield to maturity
−0.94%
Maturity date
Oct 15, 2026
US83406FAC6
SOFI TECH. 24/29 CV 144Yield to maturity
−8.75%
Maturity date
Mar 15, 2029
See all 1SOFI bonds
Curated watchlists where 1SOFI is featured.


Related stocks
Frequently Asked Questions
The current price of 1SOFI is 11.718 EUR — it has increased by 0.53% in the past 24 hours. Watch SOFI TECHNOLOGIES INC stock price performance more closely on the chart.
Depending on the exchange, the stock ticker may vary. For instance, on MIL exchange SOFI TECHNOLOGIES INC stocks are traded under the ticker 1SOFI.
1SOFI stock has risen by 1.31% compared to the previous week, the month change is a −1.08% fall, over the last year SOFI TECHNOLOGIES INC has showed a 9.84% increase.
We've gathered analysts' opinions on SOFI TECHNOLOGIES INC future price: according to them, 1SOFI price has a max estimate of 17.66 EUR and a min estimate of 5.30 EUR. Watch 1SOFI chart and read a more detailed SOFI TECHNOLOGIES INC stock forecast: see what analysts think of SOFI TECHNOLOGIES INC and suggest that you do with its stocks.
1SOFI reached its all-time high on May 21, 2025 with the price of 13.742 EUR, and its all-time low was 10.668 EUR and was reached on Apr 25, 2025. View more price dynamics on 1SOFI chart.
See other stocks reaching their highest and lowest prices.
See other stocks reaching their highest and lowest prices.
1SOFI stock is 9.41% volatile and has beta coefficient of 2.35. Track SOFI TECHNOLOGIES INC stock price on the chart and check out the list of the most volatile stocks — is SOFI TECHNOLOGIES INC there?
Today SOFI TECHNOLOGIES INC has the market capitalization of 12.81 B, it has increased by 0.87% over the last week.
Yes, you can track SOFI TECHNOLOGIES INC financials in yearly and quarterly reports right on TradingView.
SOFI TECHNOLOGIES INC is going to release the next earnings report on Aug 5, 2025. Keep track of upcoming events with our Earnings Calendar.
1SOFI earnings for the last quarter are 0.06 EUR per share, whereas the estimation was 0.03 EUR resulting in a 84.00% surprise. The estimated earnings for the next quarter are 0.05 EUR per share. See more details about SOFI TECHNOLOGIES INC earnings.
SOFI TECHNOLOGIES INC revenue for the last quarter amounts to 712.41 M EUR, despite the estimated figure of 683.07 M EUR. In the next quarter, revenue is expected to reach 703.81 M EUR.
1SOFI net income for the last quarter is 65.74 M EUR, while the quarter before that showed 321.16 M EUR of net income which accounts for −79.53% change. Track more SOFI TECHNOLOGIES INC financial stats to get the full picture.
No, 1SOFI doesn't pay any dividends to its shareholders. But don't worry, we've prepared a list of high-dividend stocks for you.
As of May 30, 2025, the company has 5 K employees. See our rating of the largest employees — is SOFI TECHNOLOGIES INC on this list?
EBITDA measures a company's operating performance, its growth signifies an improvement in the efficiency of a company. SOFI TECHNOLOGIES INC EBITDA is 540.88 M EUR, and current EBITDA margin is 16.72%. See more stats in SOFI TECHNOLOGIES INC financial statements.
Like other stocks, 1SOFI shares are traded on stock exchanges, e.g. Nasdaq, Nyse, Euronext, and the easiest way to buy them is through an online stock broker. To do this, you need to open an account and follow a broker's procedures, then start trading. You can trade SOFI TECHNOLOGIES INC stock right from TradingView charts — choose your broker and connect to your account.