$T After reached target 38.8 now SHORT targeting 36.2Overbought indicators . RSI Signal. go down to confirm breaking point and new support
1T trade ideas
T: Is ATT worth the trouble?Elliott hedge fund placed a bet the T is worth $60, probably is but its a legacy carrier, with 170BBBBBillion in debt. they bought content, and got in debt, to complete against NetFlix , Disney and the like. Its a great stock paying 5.36% in dividend yield, for all those fix income seeking steady cash flow, but I dont think it can withstand a down turn in the economy with the inverted yield screaming caution.
I dont doubt the $60 is obtainable, see the monthly view as opposed to the weekly, but not till March 2021 as per my analysis.
TA speaking we see a shooting star this week. Short term short, longterm good buy at $33 and ride the wave contingent upon they are able to withstand the financial storm 16-18 month from now.
cheers, happy trading

Nice sell Set up on AT&T I am looking to sell this stock once market rejects the 42.68 and look to limit out at the 1.618 Fib retrace-met level

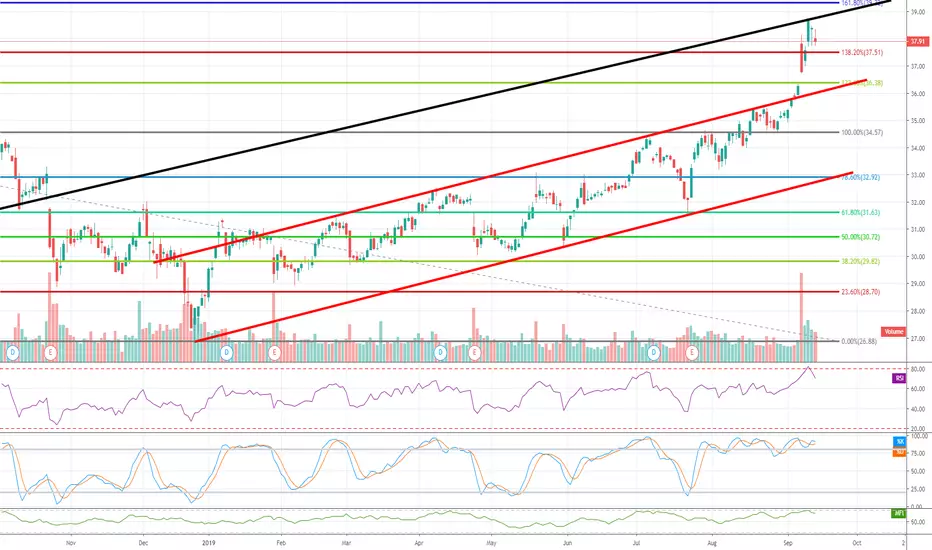
Long T in the long-term, but looks overbought at presentAT&T stock has been rising rapidly after activist investor Elliot Management announced a $3.2 billion stake in the company on September 9th.
The RSI has crossed into very oversold territory while the ADI is signaling only a moderately strong trend. At the same time, the stock has moved above its 9-day moving average, which often signals a short-term correction. The chart is going parabolic with today's trading having gone almost vertical.
But there remains many reasons to be bullish in the long-term. Long-term resistance at 37.71 has been broken through. The company announced its 5G strategy today and urged competitors to do the same. T is ahead of the competition. Earnings have met or exceeded expectations for the last three quarters and are forecasted to do well in October. The stock has an attractive dividend of 6% and has a track record of increasing that dividend.
Put options could be profitable in the near-term. Buying dips could also be a good strategy. Looking to acquire a large stake in T? Use dollar-cost averaging over time. Avoid FOMO buying during mania like this. Long-term, T is an excellent choice, but a parabolic or vertical trend accompanied by universal optimism is always cause for caution.


Rug Pull Imminent or Nah!? $TNYSE:T
I bought a small amount of Oct 18' $37 puts thinking a breather could be coming for the stock before it's next move higher (potentially).

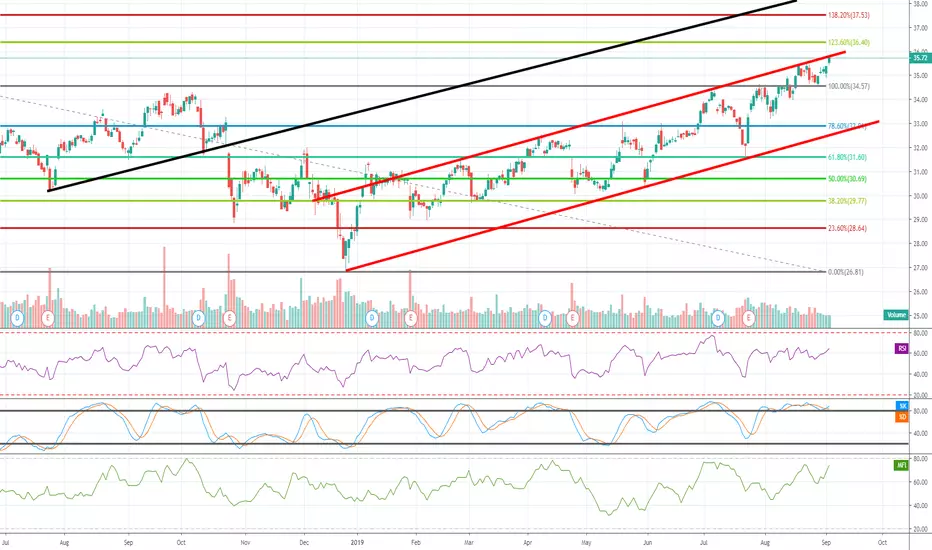
$T AT&T .. To Be or Not to Be... Bullish on long term Indicators are over bought and now at the top of raising channel . if break it up then confirmation for long bullish uptrend, if pullback from here then channel bottom will be good entry for long positions
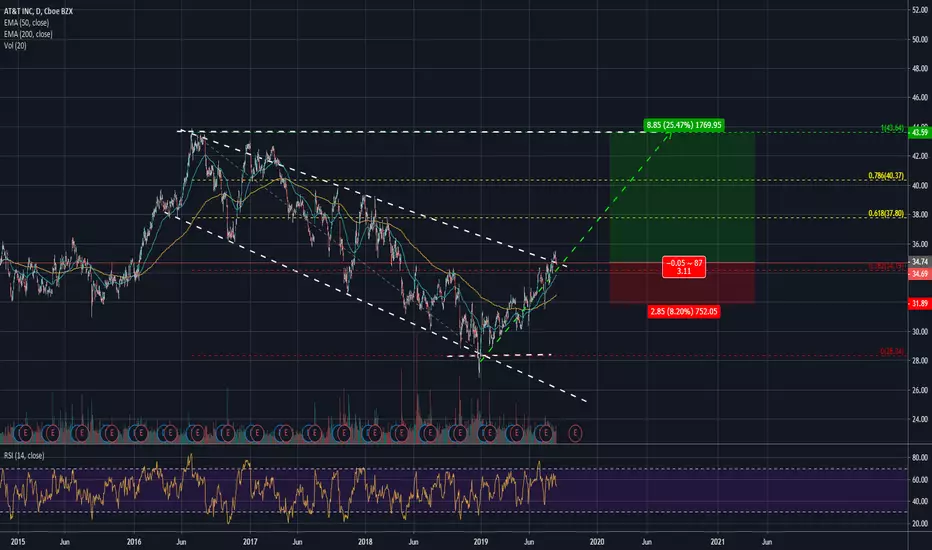
T Breaking Out50-day EMA recently crossed over the 200-day EMA. Just broke out over the $34 fib level. I'd have a price target of $43 near the top of the $8 channel and the fib Strong fundamentals, paying down debt, ~6% dividend yield. Definitely a buy. Looking to fill the $9 channel to $43.
[Short] T technical breakdownT is losing a rising wedge here, it is -0.6% on a day when the stock market is having a FOMO bounce.
T could get even weaker when the general market rolls over.
Fundamentally, a weakening economy makes T's massive debt burden harder to bear.
Would look to cover somewhere below the 50ma.

A POSSIBLE FLIGHT TO SAFETY IN AT&TIt seems that next week will bring a major flight to safety, Telecommunications is a safe haven in times of turmoil. The trade War has stepped up and once again the tech sector will fall like a stone, AT&T will be a benefactor of that. Possible look for selling on Monday but Tuesday would be a nice entry point to go long into the breakout.
AVERAGE ANALYSTS PRICE TARGET $34
AVERAGE ANALYSTS RECOMMENDATION OVERWEIGHT
P/E RATIO 14
SHORT INTEREST 2%
COMPANY PROFILE
AT&T, Inc. is a holding company, which engages in the provision of telecommunications media and technology service. It operates through the following four segments: Communications, Warner Media, Latin America and Xandar. The Communications segment provides services to businesses and consumers located in the U.S., or in U.S. territories, and businesses globally. The Warner Media segment develops, produces and distributes feature films, television, gaming and other content over various physical and digital formats. The Latin America segment provides entertainment and wireless services outside of the U.S. The Xandar segment provides advertising services. The company was founded in 1983 and is headquartered in Dallas, TX.

AT&T breaking out from fantastic base. Great risk reward long trade in AT&T, in our opinion a short term breakout is playing out with a potential upside gain of 11%.
==============
Price target $39
==============

$T:NYSE - AT&T INC - Breakout through resistance?Global telco whale looks to have broken through resistance for the second time. I feel that AT&T is primed to take advantage of the 5G rollout and sales surge.
Trading View technical indicators are showing it as a strong buy as well. Might be one to watch.
AT&T Inc. is a holding company that provides communications and digital entertainment services in the United States and the world. The Company operates through four segments: Business Solutions, Entertainment Group, Consumer Mobility and International. The Company offers its services and products to consumers in the United States, Mexico and Latin America and to businesses and other providers of telecommunications services worldwide. It also owns and operates three regional TV sports networks, and retains non-controlling interests in another regional sports network and a network dedicated to game-related programming, as well as Internet interactive game playing. Its services and products include wireless communications, data/broadband and Internet services, digital video services, local and long-distance telephone services, telecommunications equipment, managed networking, and wholesale services. Its subsidiaries include AT&T Mobility and SKY Brasil Servicos Ltda.

AT&T stock price during past 3 recessions (1990-2009)This is a totally informative publication, no prediction is being made and no advice is being given. This is simply the price of AT&T shares during the past 3 documented U.S recessions from 1990-2009 against the S&P 500.


T BreakoutT has tested the $34.5 level multiple times and is now looking at a potential breakout. The next level of resistance is at the $36 level where the 200 moving average on the weekly chart also is residing. Looking for a 2:1 risk reward with the stop being right under the 20sma.

AT & T double top and MACD divergence downPicked up this double top las6 night and grabbed some AUgust 9 33.5 puts this morning at 28c as it gapped down att he open.

ATT - SHORT SETUPTOP OF RESISTANCE RANGE. SHOWING DIVERGENCE ON BOTH OSCILLATORS. ENTERING SHORT HERE.


AT&T (T)Hitting major resistance. Can either gap up or break down to fork lines (minimum target down is the median line). Technical indicators appear to point to the downside. We will be short after a break of the signal reversal bar only. If we get upside pressure, we will only be long up to the upper forkline.
Happy Trading
NYSE:T

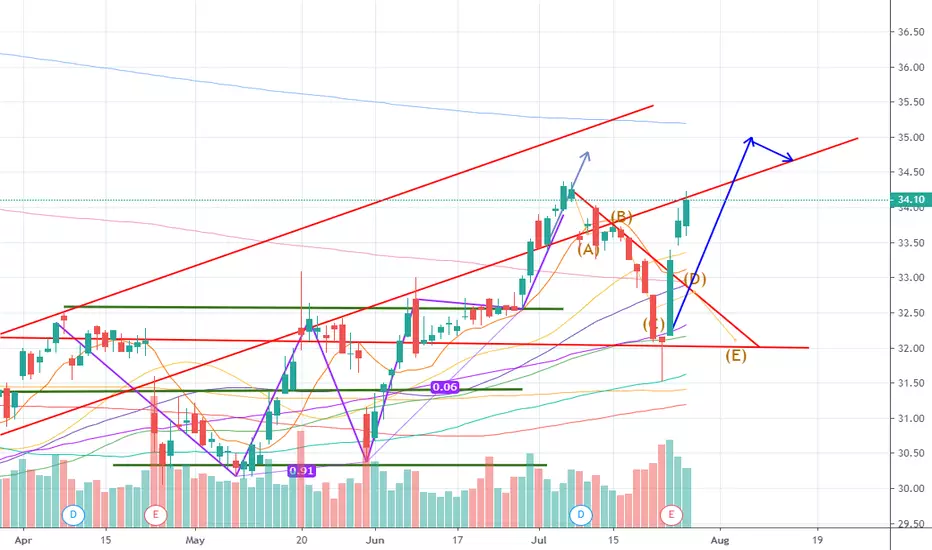
Daily T stock price trend forecast analysis. 26-Jul
Stock price trend forecast timing analysis.
See a forecast candlestick chart of 10 days in the future: www.pretiming.com
Investing position: In Rising section of high profit & low risk
Supply-Demand(S&D) strength Trend: In the midst of an upward trend of strong upward momentum price flow marked by the temporary falls and strong rises.
Today's Supply-Demand(S&D) strength Flow: Supply-Demand strength has changed from a weak buying flow to a strengthening buying flow again.
Forecast D+1 Candlestick Color : GREEN Candlestick
%D+1 Range forecast: 0.9% (HIGH) ~ -0.5% (LOW), 0.3% (CLOSE)
%AVG in case of rising: 1.3% (HIGH) ~ -0.2% (LOW), 0.9% (CLOSE)
%AVG in case of falling: 0.3% (HIGH) ~ -1.1% (LOW), -0.6% (CLOSE)

T 35.5Has already past 32.15 support and looks to target 35.5 next. It is just budding out of its downward channel and with Earnings Report I expect it to be the catalyst to the next target.

