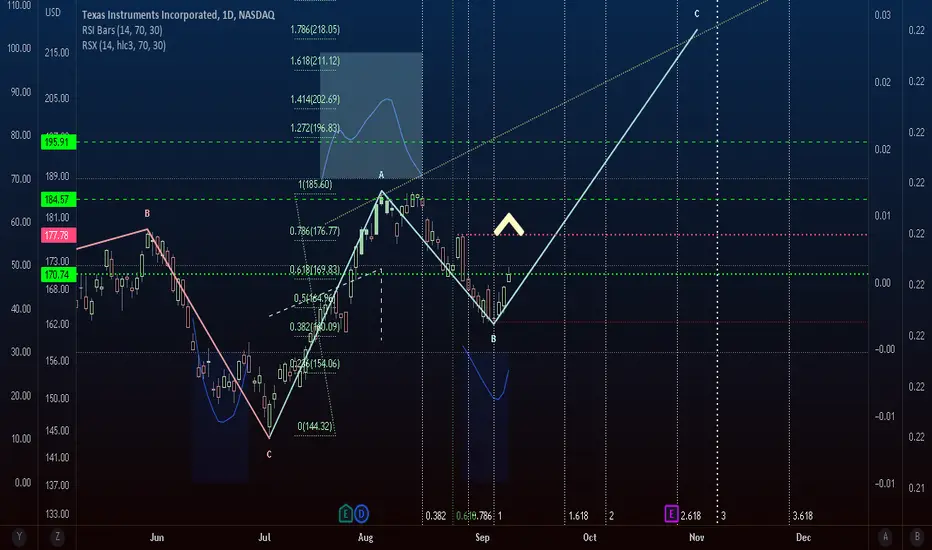
The Texan is firing it up. TXNUpgoing zigzag, prolonged ?WXY on B Wave, pre confirmation, heading for overbought normalization. I like the fact that A Wave ended with nil divergence on the daily, which is indicative of further growth at some stage down the track prost a retrace.
We are not in the business of getting every prediction right, no one ever does and that is not the aim of the game. The Fibonacci targets are highlighted in purple with invalidation in red. Confirmation level, where relevant, is a pink dotted, finite line. Fibonacci goals, it is prudent to suggest, are nothing more than mere fractally evident and therefore statistically likely levels that the market will go to. Having said that, the market will always do what it wants and always has a mind of its own. Therefore, none of this is financial advice, so do your own research and rely only on your own analysis. Trading is a true one man sport. Good luck out there and stay safe.
1TXN trade ideas
TXN PRICE FORECAST (-19%) (-32%)Texas Instruments Incorporated engages in the design, manufacture, test, and sale of analog and embedded semiconductors, which includes industrial, automotive, personal electronics, communications equipment, and enterprise systems. It operates through the following segments: Analog and Embedded Processing. The Analog segment semiconductors change real-world signals, such as sound, temperature, pressure or images, by conditioning them, amplifying them and often converting them to a stream of digital data that can be processed by other semiconductors, such as embedded processors. The Embedded Processing segment is designed to handle specific tasks and can be optimized for various combinations of performance, power and cost, depending on the application. The company was founded by Cecil H. Green, Patrick Eugene Haggerty, John Erik Jonsson, and Eugene McDermott in 1930 and is headquartered in Dallas, TX.
the soxx is there to show the downrending sentiment for stocks related to that industry
Im strong on it reversing at tp1
but there is still chance of a break

SPGIWeekly and daily RSI rolling over. Daily MACD about to cross. Daily price closed outside of price line. Price in a downtrend.

Texas Instruments say "Yeehaw" and miss. TXNGoals 160, 153.
We are not in the business of getting every prediction right, no one ever does and that is not the aim of the game. The Fibonacci targets are highlighted in purple with invalidation in red. Fibonacci goals, it is prudent to suggest, are nothing more than mere fractally evident and therefore statistically likely levels that the market will go to. Having said that, the market will always do what it wants and always has a mind of its own. Therefore, none of this is financial advice, so do your own research and rely only on your own analysis. Trading is a true one man sport. Good luck out there and stay safe

Short-term downsideTXN has run a bunch since earnings and the passage of the semis bill in congress. Now we're seeing a bunch of technical signs the stock is going to pull back.
Sitting at key resistance
Local POC (since earnings) is closer to mean from SD regression channel
MACD started to turn over
Stock is overbought
ATR is decreasing quickly
I would expect the stock to mean revert (and possibly overcorrect to support) over the next week (maybe 2).

$TXN with a Bullish outlook following its earnings #Stocks The PEAD projected a Bullish outlook for $TXN after a Positive Under reaction following its earnings release placing the stock in drift A with an expected accuracy of 66.67%.

TXN - Inverted Ascending ScallopUp Channel Breakout with a large inverted ascending scallop formation
Inverted ascending scallops are a bullish pattern, and will likely act like this as a support is found above the channel

TXN to join quick tech rally?My models say the Fed cannot raise rates beyond 0.5 points tomorrow or they cannot be trusted in the future. We should see a quick rally to end this week and perhaps begin next week, before the reality of $6+ fuel prices set in again and we continue the bear market.
Based on historical movement, the trough could occur anywhere in the larger red box. The final targets are in the green boxes. The pending top should occur within the larger green box as has been the historical case. Half of all movement has ended in the smaller green box. In this instance, the signal indicated BUY on June 10, 2022 with a closing price of 159.445.
If this instance is successful, that means the stock should rise to at least 160.195 which is the bottom of the larger green box. Three-quarters of all successful signals have the stock rise 2.0335% from the signal closing price. This percentage is the bottom of the smaller green box. Half of all successful signals have the stock rise 3.732% which is the end point of the black dotted arrow. One-quarter of all successful signals have the stock rise 5.295% from the signal closing price which is the top of the smaller green box. The maximum rise on record would see a move to the top of the larger green box. These are the same concepts for the levels in the red boxes as well.
The ends/vertical sides of the boxes are determined in a similar fashion. The peak of the rise can occur as soon as the next trading bar after signal close, while the max rise occurs within the limit of study at 50 trading bars after the signal. A 0.4% rise must occur over the next 50 trading bars in order to be considered a success. Three-quarters of successful movement occur after at least 17.0 trading bars; half occur within 31.5 trading bars, and one-quarter require at least 45.0 trading bars.
The black dotted arrow represents median historical movement. Medians are a good metric, but they are just one of many I use when forecasting future movement.
As always, the stock could decline the very next bar after the signal without looking back (therefore the red boxes would not come into play) or the stock may never decline (and the green boxes may never come into play).

TXN $TXN Initial ShortTXN $TXN Initial Short. TP and S on chart. Move SL on TP. After TP2, trail with 0.5ATR step and 1.5ATR offset.


$TXN with a Neutral outlook following its earnings #Stocks The PEAD projected a Neutral outlook for $TXN after a Negative over reaction following its earnings release placing the stock in drift C with an expected accuracy of 57.14%.

Texas Instruments ShortNASDAQ:TXN
Texas Instruments is about to break weekly cloud support.
Over the past twenty or so years, price has completed or nearly completed various inverted arcs.
I listed various targets based on Fibonacci retracement levels.
I tend to think T2 61.8% retrace level at $135 is the most viable target level, with support from the pre-Covid crash highs
However, if the Fed keeps tightening it would not surprise me if price kept moving towards completing the arc to T3/T4.

Texas Instruments TXN - A Beautiful Short Setup HereThis is such a nice short setup. Risk/reward is excellent. If you've ever wondered what a good short setup looks like from a price action perspective, this is it.

TXN exposure to ChinaThe U.S. warning China it could face devastating sanctions if it defies the ban on doing business with Russia!
This is a move that could have huge impact on American companies.
54% of TXN Texas Instruments revenue comes from China.
My price target from TXN is $134.
Looking forward to read your opinion about this.

$TXN with a Bullish outlook following its earnings #Stocks The PEAD projected a Bullish outlook for $TXN after a Positive over reaction following its earnings release placing the stock in drift B.
If you would like to see the Drift for another stock please message us. Also click on the Like Button if this was useful and follow us or join us.

TXN: Gapped down below 200 MAThe stock seems to have reached a local high and seems to have reversed the trend. That nasty gap down is not a good sign at all. If it's followed by a sharp sell of (drift down) it could indicate that heavily invested entities are dumping their shares. I wouldn't suggest going short just now. I will come back to this in a week or 2 to re-evaluate the situation.

$TXN Is prone to fall... [TEXAS INSTRUMENTS INCORPORATED]NASDAQ:TXN Is likely to fall next few days/weeks 1st target would be 182
Follow for more updates...
#AHMEDMESBAH

TXN: BIAS UPOverall this stock is still in a weak bull mode and in ranging status. Possible bounce from the support. Apply SL and TP, trade safe.

TXN our gains, pleasure or pain?Hey traders,
Just clicking around and found a funny line.
Strong fundamentals - Yes, they are taking on some debt...but it's calculated.
Will always be required for math
Retracement incoming
Obviously, market is wound up and hard to tell which way it will go (go look at SPX ). I think there might be a couple of good retracement plays here. Long @ .618 - .9 (pretty much anywhere within GANN BOX for reference).
You may have to wait for earnings to slam this into support levels.
What do you think?
Not financial advice!
Thanks for reading, trader!

$TXN with a Neutral outlook following its earnings #Stocks The PEAD projected a Neutral outlook for $TXN after a Negative over reaction following its earnings release placing the stock in drift C with an expected accuracy of 50%.
If you would like to see the Drift for another stock please message us. Also click on the Like Button if this was useful and follow us or join us.

TXN Longin weekly up trend
Wedge breakout + retest
Wedge bottom line (trendline touch 6th)
Entry 186.5
Stop 183
Target 210
Risk management is much more important than a good entry point.
I am not a PRO trader.
In my trading plan, the Max Risk of each short term trade should be less than 1% of an account.

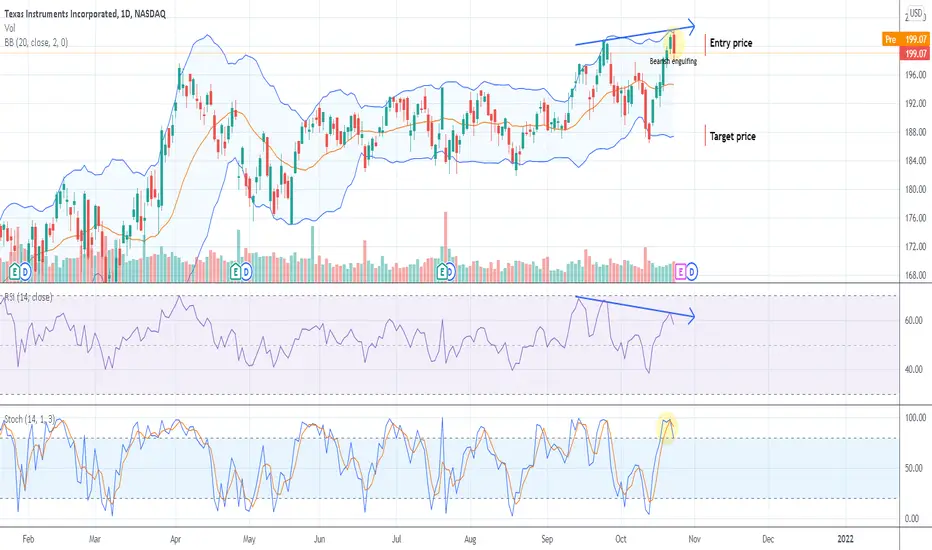
TXN shortEntry price: 199-201$
Target price: 186-189$
Bollinger bands: the price approached the upper boundary
RSI: bearish regular divergence, therefore, the price retracement is likely to occur
Stochastic: the asset is overbought
Candle pattern: bearish engulfing
Conclusions: All indicators suggest trend reversal in the near future. Thus, the short position is recommended.
No financial advice
$TXN been stress free trading this$TXN has been following this trading range nicely for months for some stress free options swings.
