1UPST trade ideas

support is breaking, not a great sign for longs here UPST getting dangerous for longs here, many rejections from trend resistance and breaking important support zones.
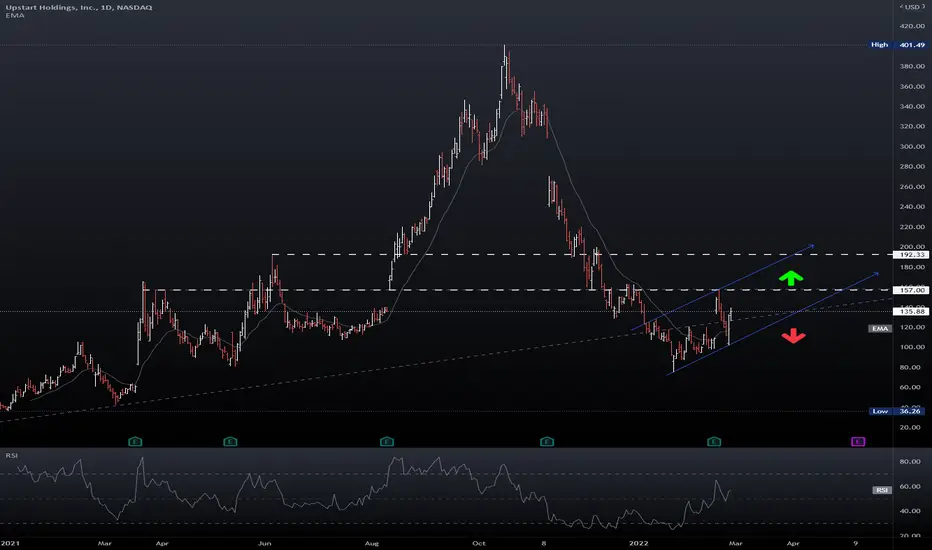
long term it can dump to 43.56-13.48.. but if we break back above trend resistance we go bullish again. If this happens targets are 143.14-164.57

UPST Key Level to WatchUPST currently sitting at support around $74 ~ 75 and if it breaks this level we could see stock trading around $50.

UPST - double from here in just 1 month ?Rotation from Value to Growth about to start. Nobobdy knows the size of it, but due to extreme pessimism, it could charge hard as FOMO kicks in. Need to recapture 100+ to confirm.

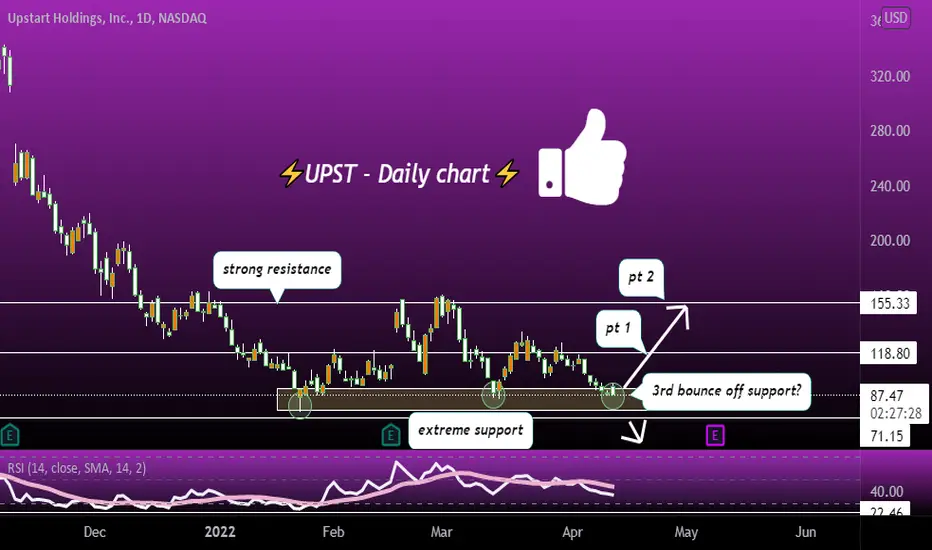
make or break area! will support hold? 🤖UPST sitting at extreme support zone, if it breaks we will see a lot more downside! If we hold and bounce here my targets are 118.80-155.33
a nice pennant on the dailyi am looking for a swing trade over the next 20 days playin some options follow for more

UPST - triangle breakdownContinues to act weak and now breaking below triangle support...likely tests 86 in coming days if loses 101.

Long position short termNASDAQ:UPST Upstart is an AI lending platform that partners with banks and credit unions to provide consumer loans
look for gap fill at the $64 mark if it drops under $100
$UPST1hr$UPST1hr currently sitting on support of this triangle. This has a very good risk to reward ratio if were to go long and just by targeting previous high. The full measured move has greater reward

UPST to $140it's holding strong support through the trendline and tested multiple times and could be ready for a bull run if the market remains bullish.

Unbiased UPST playLooks like we are at a crossroad here for day traders on UPST, the recent is an uptrend but overall can play either direction

UPST - Weakness is worrying
Weakness relative to the strong rally in other growth names should raise some alarms for investors.
[*} showing signs of a developing H&S pattern...right shoulder in progress.
I'd watch the 3 day candle closing on April 01. If it doesn't close above 118, it'd indicate 9EMA rejection and further downside to follow.
I am long at 106, with B/E stop loss. below, 94 is possible. Not saying it will happen, but keeping mind open to anything to come.

$UPST trading it 3/30above 123
129-131 possible intraday
idea only valid if market green/positive 2morrow
#optionstrading #options #daytrading #tradeideas #stockmarket

UPST Ready for $155After being beaten down lately it is ready to make a higher move with bullish momentum in a tech stock.
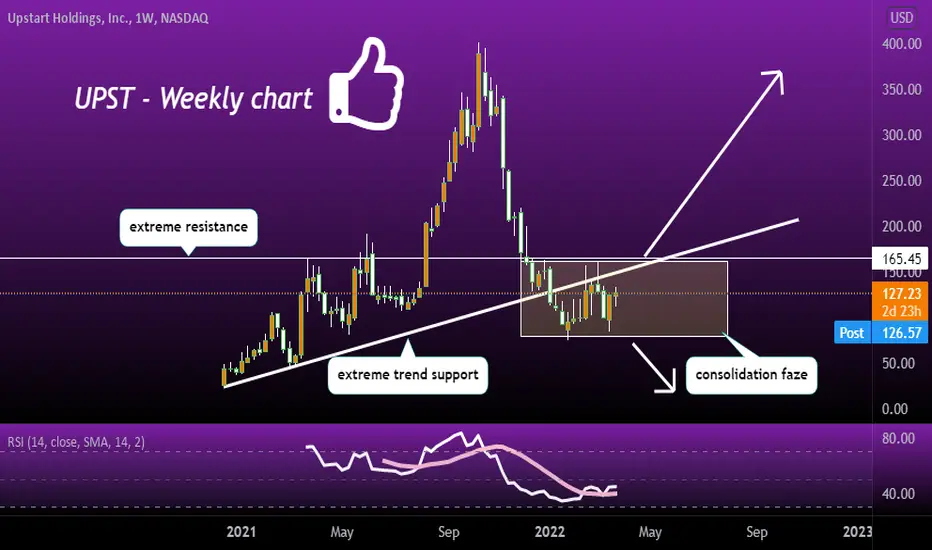
consolidation faze before the breakout ? yesss UPST in consolidation faze, not bearish or bullish its just stuck at the moment. Looking for a move below support to go short, if we climb back above extreme resistance/trend support then I'll take a long position.
Upstart USASun Storm Investment Trading Desk & NexGen Wealth Management Service Present's: SSITD & NexGen Portfolio of the Week Series
Focus: Worldwide
By Sun Storm Investment Research & NexGen Wealth Management Service
A Profit & Solutions Strategy & Research
Trading | Investment | Stocks | ETF | Mutual Funds | Crypto | Bonds | Options | Dividend | Futures |
USA | Canada | UK | Germany | France | Italy | Rest of Europe | Mexico | India
Disclaimer: Sun Storm Investment and NexGen are not registered financial advisors, so please do your own research before trading & investing anything. This is information is for only research purposes not for actual trading & investing decision.
#debadipb #profitsolutions

$UPST Bullish Cypher FormationsUpstart Holdings, Inc. operates a cloud- based artificial intelligence (AI) lending platform in the United States. The company's platform aggregates consumer demand for loans and connects it to its network of the company's AI- enabled bank partners. Its platform connects consumers, banks, and institutional investors through a shared AI lending platform. Upstart Holdings, Inc. was founded in 2012 and is headquartered in San Mateo, California.
UPST - at a key supportlosing all daily moving averages on volume...needs a lot of fireworks above current level to justify long position.
break below could test January low at 77.
I am bullish LT, but price is otherwise right now.

Pull Back Fishing/Be SafePositive moving average crossover when the 20 day moving average crossed through then above the 50. However price is below these 2 moving averages today.
Red Marubozu candle, with both end shaven at this moment which is bearish. As a rule, price goes down further when you see this candle as it is bearish.
A support level is down below. Stronger support levels below this one/green dashed lines with the thickest dashed line being the strongest. If price were to breach that last support level, then there is no support underneath and it will end up like HOOD and RIVN, gasping for air. Let's hope not but something to be aware of and is the "sux rox" part of trading newer securities.
A Death cross is defined to some as the 50 (orange) passing down and through the 200 (red), but there are those who define a death cross as the 50 crossing through the 100 (yellow). These are warning signs, but again, moving averages are lagging indicators.
No recommendation and be safe. This one may be best to avoid or to trade short term until the market chills out a bit.
Short percent is 15.5% which is on the high side.
The 4 most expensive words in the English language are "This time it is different"

UPST - Day Trade Opportunity to go SHORTI am really liking a Day Trade Opportunity on UpStart
Looking at purchasing PUT OPTIONS on this one.
Ideal set up is for us to get a little buying activity to retrace back to structure in the 137-140
Target is 105. Looking at a 2-3 Week Contract for this move, however expecting the full move to happen in 6-8 days.

UPST bounced at support As we can see $upst has strong support at $107, I am hoping it to run to $160 this week. If it breaks resistance at $160 next stop will be $190. This is just my analysis. do your own research.

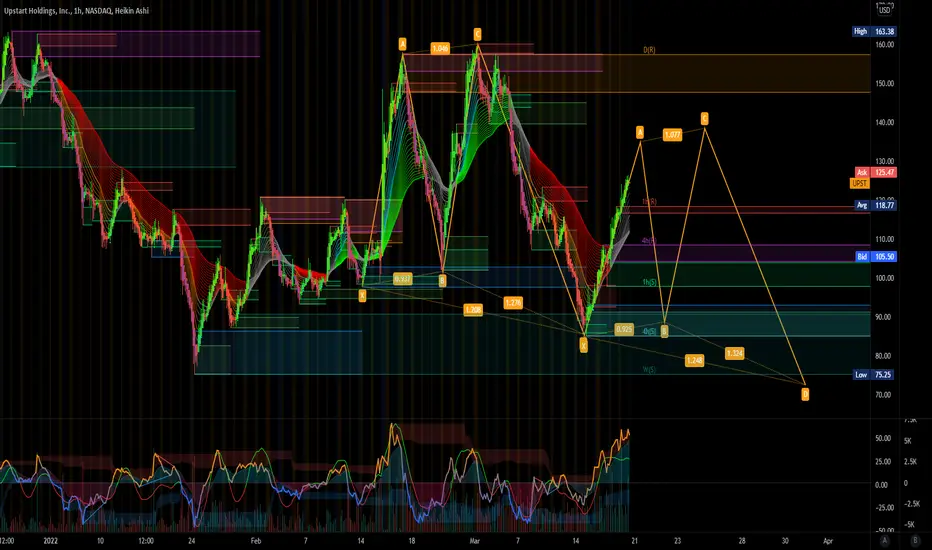
UPST - X WaveChart request.
With uptrend long broken UPST appears to be in an X wave connection to take price down to $30 area.
Moving averages death crossing and UPST could well pierce through the 20 and 50WMA to complete a fakeout X wave around 0.5 / 0.618 before entering a primary W wave to the 1:1 target.
Not advice.

