Trading idea on ZM - Good risk/reward ratio!Hello dear community! This is my first post here, so, I hope you like it 😊
I want to share with you a trading idea on ZM 🚀:
Buy point: 314.58
Stop-loss: 311.79
Exit point: 325.48
Risk/Reward ratio: 3.91
If you liked this trading idea, remember to click on the “Follow” button to get more trading ideas like this, and if you agree with me, click on the “Agree” button 😉.
See you soon,
Melissa.
1ZM trade ideas

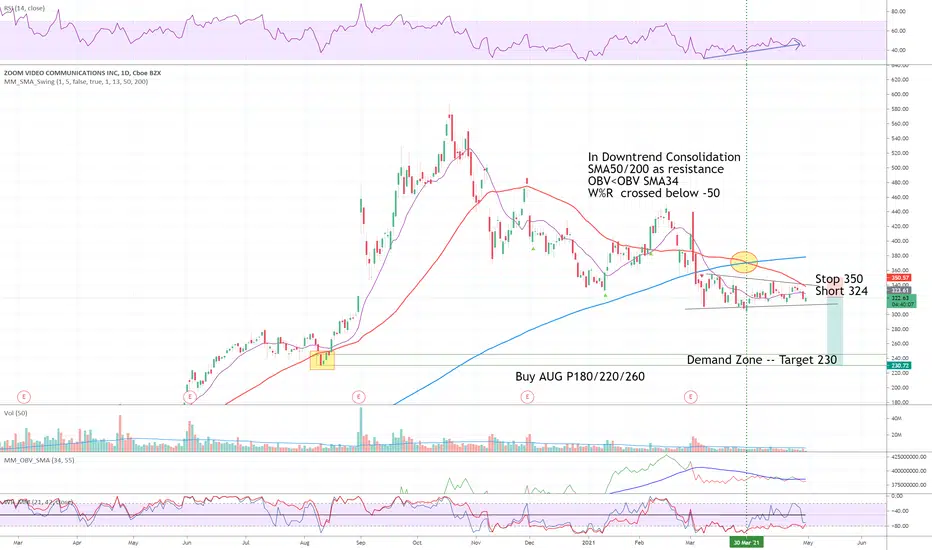
ZM ShortIn Downtrend Consolidation
SMA50/200 as resistance
OBV<OBV SMA34
W%R crossed below -50
Short 324
Stop 350
Target 230
I am not a PRO trader. I trade option to test my trading plan with small cost.
The max Risk of each plan should be less than 1% of an account.
ZM - very high reward in the next couple weeks before ERZM is looking for to break out of the giant ascending triangle that sellers created back since October 2020. And if ZM created another golden cross like it did back in Feb 2020 then we will see a huge move return back to the uptrend (The triangle to me is like accumulation zone to prepare for the big move). In general, ZM is still in the long run bull market if it won't create death cross in the next few days. If we look the whole pic, ZM is just started the bull run since Feb 2020 after almost 187 days of accumulation.

$ZM Preparing for massive move upside The pattern is considered as a sloped accumulation. it will target higher numbers.

Trading map for ZOOM / Our filters to develop setups.Today we will speak about the exact situation we are waiting for before developing bullish setups on ZOOM.
Our trading philosophy is: Define the future situation you consider worth trading. Wait until that happens. Trade or Cancel the setup.
What are we waiting for on ZOOM?
1)Wait for the breakout:
We want to observe a clear bullish movement that breaks the current consolidation defined with the two yellow lines.
2)Wait for 5 - 10 days corrective pattern:
After the breakout, we want to observe sideways movements on the edge or above the broken structure (yellow lines) with a duration between 5 to 10 days
3) Look for a 1:4 risk-reward ratio setup:
Suppose the breakout and the sideways movement happens. We will be ready to trade that pattern. We want to be able to catch a 1 to 4 risk reward ratio setup AT LEAST. Why? Because that means that we are risking 1 dollar to make 4 dollars, and if we are right only 40% of the time on this setup, we are still extremely profitable. Also, once you have a clear breakout of a corrective pattern of this size, you tend to see bullish movements with similar proportions to the consolidation.
Thanks for reading; we hope this content was useful!

Zooming downwardsLooks like a death cross has formed on the daily chart for zoom. I’ve initiated a short position. Good luck to all.!

ZM FALLING WEDGE ZM falling Wedge... possible July timeframe for a breakout. 280$ is nice support for this to work

ZM holding on for lifeZM seems to be in a pretty bad position at the moment. Struggling to gain much traction above it's uptrend line set back from March 2020:
It's well under key averages for some time now and showing not a great amount of strength.

$ZM | Bullish Inverse Head and Shoulders$ZM broke out of a bullish inverse head and shoulders pattern
Price just retested the neckline of the head and shoulders pattern. Watch for a bounce from the neckline for continuation to the upside.
Goodluck!
Let me know what you think in the comments. Please leave a like if you agree with my analysis! 👍🏽

Bearish momentum of Zoom comes to and endI look at Zoom correction as a non-standard correction small x wave where it started with zigzag and ended with flat. Then flat formed an ending diagonal indicating that bearish momentum is weak together with the bearish divergent signal from CCI. Eventually, the price broke away from that triangle line which I see as wave1 then now it's forming some sort of non-standard correction large x wave which I see as wave 2. If it's now ending with running flat as I do hope. The price will not go past the gap that just occurred and will start strong bearish wave 3

Poke the Bull's 6 months of consolidation/correction. It needs to trade above 200MA where it will break this wedge and touch new records.
Short Idea $ZM - Watch for wedge breakThe risk to reward on this is favorable IMO. Bearish Divergence in the chart (See sloping Money Flow Index). Also, with a lot of folks returning to the office, expect growth to slow in this name. 1st target 316 then 302.


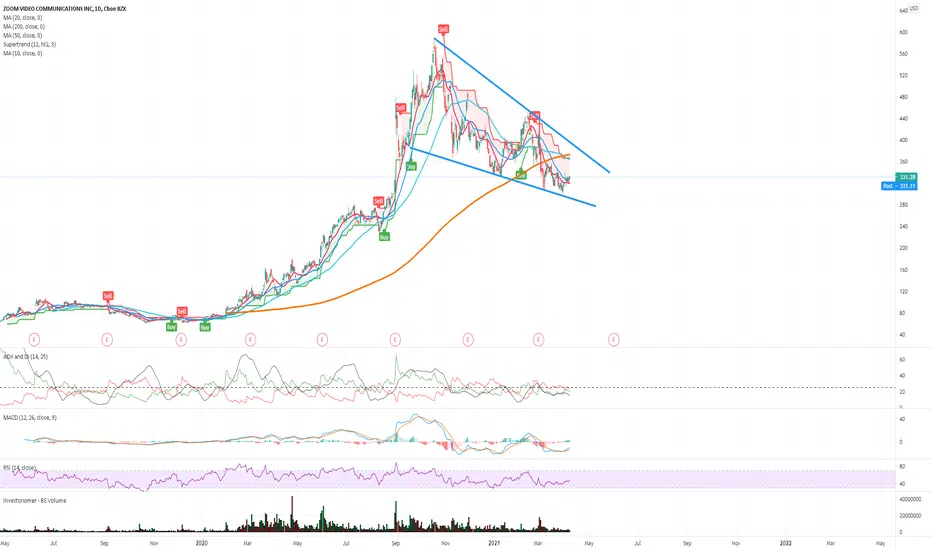
Wake up ZM BULL - Golden cross or Death crossER is coming in June. ZM is running within the descending triangle and this pattern is bullish pattern and it has enough time consolidation. Will ZM create Golden cross or Death cross????

Trading plan on ZOOMToday we will analyze zoom, and we will provide the setup we will be waiting for in case we observe a similar price action.
Important items:
a) The price has been on a Descending Wedge for 170 days (corrective pattern).
b) Currently, the price is supported on an ascending trendline + Lower trendline of the Descending Wedge.
c) If the price breaks the ascending trendline, we can expect more bearish pressure towards the next support zone at 235.00
d) If the price cannot break the ascending trendline, we want to wait for a breakout of the wedge pattern. After that, we will look for a throwback (retest of a broken zone)
e) With all the previous conditions, we will trade above the throwback, and we will set our stop loss below it. The minimum risk-reward ratio we are looking at on this setup is 3.5
Thanks for reading!


ZM Short PutShort the 200 Put expiring 5/21 (60 DTE) for $1.15 Cr. It has a 95% POP and $2120 BPE for a 5% ROC. Considering that ZM is trading around $330 today, ZM will need to tank 40% to hit the breakeven for this trade. While this isn't a risk-free trade, it is a high-conviction and high-probability trade.

Falling Wedge $ZM - Target ReachedMy target was reached once $ZM broke through the 61.8% retracement level and hit my target of 330.03.

zm to zoom?Vert close to returning to newer heights. start nibbling into long positions here. look for a price lower than (Y) to long. full long position above (d)

Falling Wedge $ZMFalling Wedge bullish pattern on ZM, target is roughly at $330.03, after that it could potentially see $335-337.

ZM - benefiting from lock downsSTOCK IS CLOSE TO BREAKING DOWNTREND. NEEDS TO GO ABOVE THE WHITE LINE. HAS SUPPORT AT LOWER WHITE LINE. IF IT BREAK $330 WE SHOULD SEE $350 PLUS SOON.
MACD ALSO CURING UP

$ZM 2HR Zoom has gone everywhere and nowhere for months. Stock is heavily swayed by news of vaccines, new virus strains and the owner moving 40% of his stake. Finally a setup has a arrived with this beautiful daily falling wedge. Previous day closed as a shooting star, showing retracement is possible. Longs can be taken into demand or above previous weeks high. Since there is no bottom yet the safest play can be above previous weeks high. Falling Wedges are dangerous because they can keep falling. This is just a idea, or possible outcome.

ZM getting tighter and tighter$ZM with a perfect tap & reject of mini trend.
- Tight consol in pattern within pattern
- Call it a H n S w/ neckline if you want
- Closed above the 8 ema
- Challenging the 20 SMA
- 5 SMA to cross 10 SMA
- Plenty of room to upper band
Top watch and will trade all month
