Market Update - 2/16/2024• Mixed signals -> large caps seem like they are just starting a new uptrend while small caps are looking the worst in a while
• Breakouts overall still don't seem to work, EPs are probably better and pullback buys, though I haven't seen much traction (nor do I have much experience in those tbh)
• Given I'm in a large drawdown since December, I'm doing some research and realized a few things:
• I'm not adjusting my risk $ and position sizing in bad market times
• I don't take into consideration my streak of gains/losses to determine how aggressive I should be
• I have FOMO and prefer to enter trades than miss out on them
• However, the above is only true for new trades, because I do have a fear of re-entering trades where I got shaken out, which are many times massive winners. I already have a long list of these names where I got shaken out only to miss the biggest moves. Interestingly with some names I did it correclty like with NASDAQ:SOUN , by re-entering a little higher after getting shaken out.
• It's probably because I'm rarely aware of what I'm buying and how the stock could benefit from the market environment and leading themes.
• In general I fail to identify leading themes and sectors
3HCS trade ideas

End of Year Palladium Bull Run \o/From the current notation, I see this leveraged ETF on Palladium rising approximately 45% until the end of the year. The reasons are as follows:
Fundamental Factors : With increasing sanctions on Russia, one of the main exporters of palladium, global supply may become constrained. Furthermore, inflationary pressures might drive commodity prices higher. Technical Indicators : The Palladium chart has recently formed a higher high, and a higher low appears to be developing. The price has crossed above the 200-day SMA, and now the 30-, 50-, and 200-day SMAs are bullishly aligned. Seasonality: The seasonal strength in OANDA:XPDUSD is expected to begin the week after next.
So, we could get ready for rising prices in Palladium!

Market Update - 9/1/2024• market continues to be in a bull market
• good economic data and sticky inflation led to a selloff in TLT -> rate cuts might not be as soon or as aggressive. but good economic data is good for equities
• lots of setups in healthcare and finance names
• tech is still in correction and small caps are leading which is a good sign for me
• still less than 50% invested, waiting for more follow through on my breakouts, which so far has been quite weak
• other than a few good EPs and large breakouts, most setups don't follow through

Longing Inverse FTSEClearly oversold on the weekly inverse chart(overbought on the normal FTSE Index), showing bullish variables for a long as well as a harmonic deep crab has formed. Treat. Should be up and running in the next 3-4 weeks.

Short-Term Short Trade in CopperAs copper futures might technically drop the leveraged short ETF on copper will rise ...

VIX could explode anytimeCan you remember the Corona Crash?
VIX spiked up to a reading of 80. and VIXL made a stunning 3500% profit!!!
I think a similar event is about to happen over the next 6 month's. (most likely just around the corner)
Right now we are in a Bear Market, and we haven't seen capitulation yet, which is quite normal in such a market.
When this happens the VIX should spike up to 45-80 which would equqal with enourmous profits in VIXL (probably 5-30x)
Right now VIXL is around a reading of 1.
I just wanted to remind everyone of this oppertunity.
Of course, long term you lose money with VIXL, but when you expect a VIX above 40 it can get very profitable short term.
Just an idea from me, no investing advice.
Cheers✌

Buying the QQQS, shorting the QQQGreen line is my (in profit) stop loss - if it closes at that point I'm already nicely in profit.

Showing Silver is not about to break to the upsideThis 3x Silver ETF shows it to still be in a downtrend, with no sign of a reversal yet

wisdomtree stoxx banks 3x vs other indicators ...wisdomtree stoxx banks 3x vs other indicators (bonds and copper/gold ratio) ...

Getting excited about Silver? 3LSI says, "Not yet". Good rise for silver since it tanked in March, but no need to get excited just yet.
Now it has to get past 200 EMA (280) and 313 resistance to start a bullish trend.

VILX - VIX ETF 2.25 Volatility - Fibonacci Summer CorrectionI'm thinking to make a nice play on my upcoming correction belief.
Only option I have with my broker is VILX, so started looking into it's history.
Only makes big money with big crashes / corrections, and I think we have two on the way.
Data was so small for the main chart, but looking at the RSI here, some very interested volatility wave patterns.
I'm always interested to see if there is fib correlations in dates and movements, and this one took some old school math to show.
Very interesting!
Soon be time to make a play on this, wish me luck ;)

Fun With Fibonacci - VILX Fund - Amplified VIX I'm 100% certain a big correction is coming (possibly barring any stimulus that may scupper this, likelihood is it could even be the cause!) start of Q2 2021.
I want to make a Vix play on this and this is my only option with my broker so been taking a dive.
Straight away, arcs of intent everywhere, clear ebb and flow patterns. Being a fib fan, especially in waves scenarios, I wanted to see if could find anything.
Has to be said, this is not a science, on big charts small changes in chart points can lead to big number changes, but I found my rough measurements correlated very well to Fib numbers, and the one that didn't so much can be explained in a fib way (confirmation bias?).
However what I loved was the adding up of the ratios and finding them to tally to sets of 3's.
Other than the 1.62 which is clear fib ratio, I'm not so sure of the other ratios, although 1/2 .38 + .62 comes close to .78 so maybe it's just my numbers are slightly off.
Anyway, gives a nice system to work to in order to guess the coming time span of future volatility lengths.
However, I have guessed these at the end based not only on the underlying 3 number but also based on some S&P500 chart fib work I have done.
This is on another account but I really must / will remake it here to be published, keep you eyes peeled!

QQQ3 vs TQQQWhat is going on with these?
Theoretically, they are supposed to do the same thing, that is to triple leverage the Nasdaq (QQQ).
Can anybody tell me why in November QQQ3 tanked?


European banks now going into reverseConcerns reemerging about a debt crisis. In this tripple leveraged instrument, there is a breakout from the trend.
Due to it's very volatile nature, risk management must be on point.
Stop loss so important to accompany this trade
I'm short banks (long this inversed instrument)


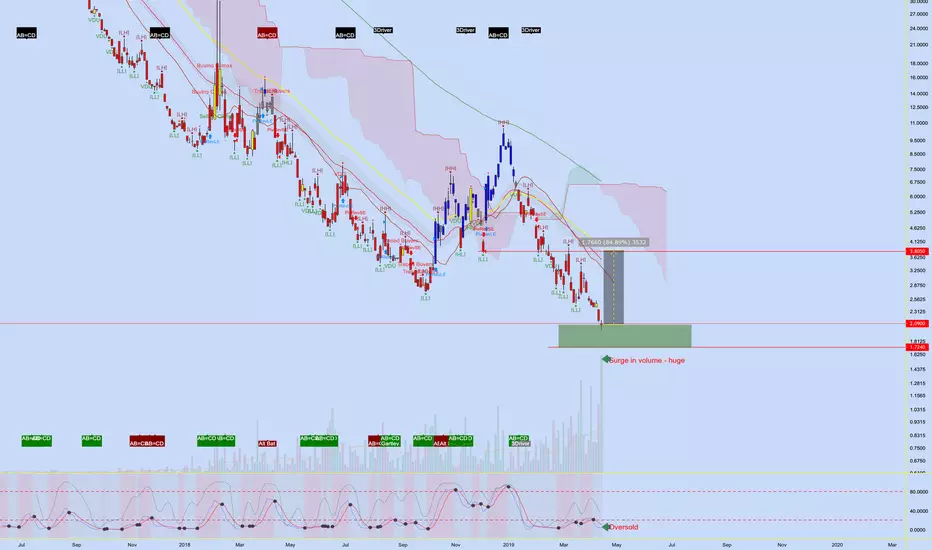
LONG, i.e. BUY (ETC 3X SHORT DAX)3DES (MILAN or FRANKFURT) UP ON the tether line + hull moving average green! Long the 3Xshort and stop loss 4,89 . Rising Volumes , as before the covid crash

VIXL Speculative HedgeMIL:VIXL If breaks above upper Bollinger band soon, may be an opportunity for Short-Term hedge. May stay within normal range, but if it spikes above bollinger band...may be a good ST hedge.


Up to €80/shareSince Europeans can't trade many American ETF's anymore, I now have to search for European ETF''s and trading opportunities.
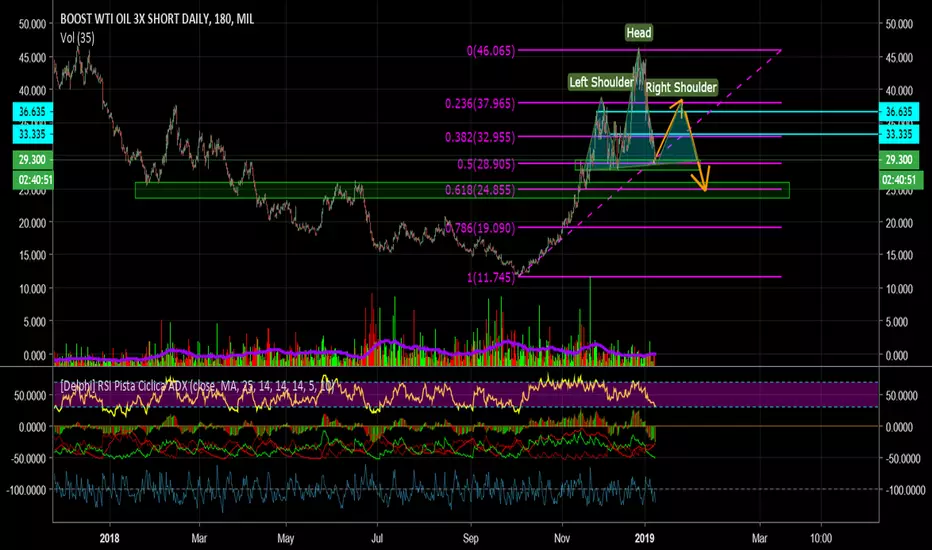
Let's try this tripple leveraged oil thing ETF.
