MINAUSDTlet see what will happen my expactation it is. it is doing w and high. there is idm level and below of it exist fvg and order block when you check daily and weekly you will see the level which i mention
MINAUSDT trade ideas

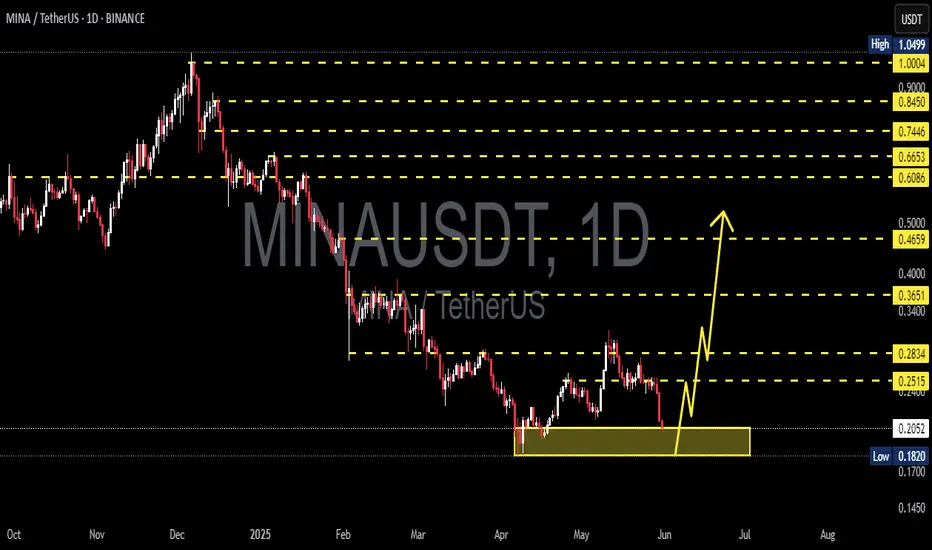
MINA/USDT – Major Downtrend Breakout! Early Signs of Reversal?📈 Full Technical Analysis – MINA/USDT (1D Timeframe)
After enduring a prolonged downtrend since late 2024, MINA is now showing strong technical signs of a potential trend reversal. A decisive breakout above the long-term descending trendline suggests that bullish momentum may be gaining traction.
🟨 Consolidation Phase & Strong Breakout
Price was previously stuck in an accumulation zone between $0.18 and $0.21 for several weeks.
The breakout occurred right after a successful retest of this key support zone, confirming it as a new demand area.
The structure also validates the formation of a descending broadening wedge, a bullish pattern that often signals exhaustion of selling pressure and the start of a new uptrend.
🟢 Bullish Scenario
If bullish momentum continues, here are the next key resistance levels to watch:
1. $0.2984 – Minor resistance and a psychological barrier.
2. $0.3686 – Previous swing high.
3. $0.4511 – Primary technical target based on the wedge height.
4. $0.6562 and $0.8425 – Potential mid-term targets if momentum accelerates.
✅ A daily candle closing above $0.25 with strong volume would further confirm the bullish case.
🔴 Bearish Scenario (Risk Case)
Despite the breakout, a failed continuation could still trigger a bearish move:
If price falls back below $0.21 and fails to hold the newly established support zone ($0.18–$0.21), this would suggest a false breakout.
A drop below $0.18 may retest the recent low at $0.1459, bringing back bearish sentiment.
⚠️ Watch closely for volume confirmation and rejection signs to avoid a potential bull trap.
🔍 Pattern in Play:
Descending Broadening Wedge ➜ Typically signals a bullish reversal after a downtrend.
Breakout + Successful Retest ➜ One of the strongest technical signals, indicating that previous resistance has turned into support.
🧠 Market Sentiment & Strategy:
Current Sentiment: Moderately Bullish
For short-term traders: Entries on pullbacks near $0.21–$0.22 with targets at $0.298–$0.368.
For swing traders: Hold positions while price remains above the breakout zone; aim for $0.45 or higher.
🔖 Conclusion:
MINA has delivered a powerful breakout from a long-standing downtrend, supported by a successful retest and a solid bullish structure. As long as the breakout holds, there's strong potential for a trend reversal and mid-term upside continuation. However, discipline and risk management remain essential in this volatile crypto environment.
#MINA #MINAUSDT #CryptoBreakout #TrendReversal #TechnicalAnalysis #Altcoins #WedgePattern #BullishBreakout #SwingTrade #CryptoSignals #PriceAction

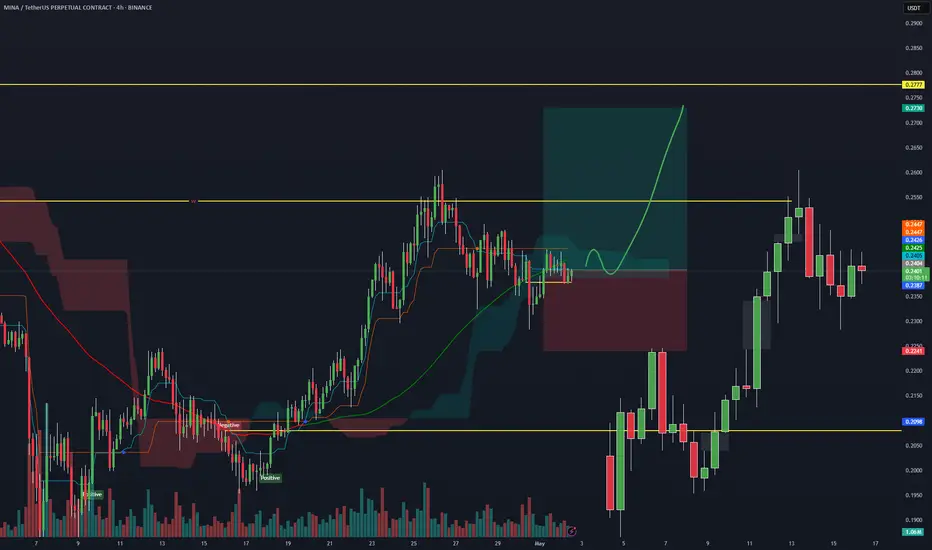
MINAUSDT: The Ground is ShiftingIn markets filled with noise, clarity comes from listening to the chart's subtle whispers. For MINA, those whispers are growing louder.
Let's look at the evidence. The Orderflow is no longer a one-way street; we are seeing signs of strength returning. At the same time, Volume is starting to build. This isn't a spike of panic or euphoria, but the steady hum of accumulation—a sign of quiet confidence.
When the ground begins to shift, a good trader doesn't jump blindly. They have a plan.
The blue boxes on the chart highlight two logical areas of interest for potential longs.
The upper blue box is the first zone of potential support, an area where buyers may show their hand soon.
The lower blue box represents a deeper foundation of value. An entry here would require more patience but could be built on stronger ground.
The idea is simple: have a plan, watch for the price to enter these areas of interest, and act with discipline. A plan without a pre-defined exit for when you're wrong is just a wish. The goal isn't just profit; it's the peace of mind that comes from trading with a clear map.
The chart is telling a story of a potential turn. Are you prepared to listen?
📌I keep my charts clean and simple because I believe clarity leads to better decisions.
📌My approach is built on years of experience and a solid track record. I don’t claim to know it all but I’m confident in my ability to spot high-probability setups.
📌If you would like to learn how to use the heatmap, cumulative volume delta and volume footprint techniques that I use below to determine very accurate demand regions, you can send me a private message. I help anyone who wants it completely free of charge.
🔑I have a long list of my proven technique below:
🎯 ZENUSDT.P: Patience & Profitability | %230 Reaction from the Sniper Entry
🐶 DOGEUSDT.P: Next Move
🎨 RENDERUSDT.P: Opportunity of the Month
💎 ETHUSDT.P: Where to Retrace
🟢 BNBUSDT.P: Potential Surge
📊 BTC Dominance: Reaction Zone
🌊 WAVESUSDT.P: Demand Zone Potential
🟣 UNIUSDT.P: Long-Term Trade
🔵 XRPUSDT.P: Entry Zones
🔗 LINKUSDT.P: Follow The River
📈 BTCUSDT.P: Two Key Demand Zones
🟩 POLUSDT: Bullish Momentum
🌟 PENDLEUSDT.P: Where Opportunity Meets Precision
🔥 BTCUSDT.P: Liquidation of Highly Leveraged Longs
🌊 SOLUSDT.P: SOL's Dip - Your Opportunity
🐸 1000PEPEUSDT.P: Prime Bounce Zone Unlocked
🚀 ETHUSDT.P: Set to Explode - Don't Miss This Game Changer
🤖 IQUSDT: Smart Plan
⚡️ PONDUSDT: A Trade Not Taken Is Better Than a Losing One
💼 STMXUSDT: 2 Buying Areas
🐢 TURBOUSDT: Buy Zones and Buyer Presence
🌍 ICPUSDT.P: Massive Upside Potential | Check the Trade Update For Seeing Results
🟠 IDEXUSDT: Spot Buy Area | %26 Profit if You Trade with MSB
📌 USUALUSDT: Buyers Are Active + %70 Profit in Total
🌟 FORTHUSDT: Sniper Entry +%26 Reaction
🐳 QKCUSDT: Sniper Entry +%57 Reaction
📊 BTC.D: Retest of Key Area Highly Likely
📊 XNOUSDT %80 Reaction with a Simple Blue Box!
📊 BELUSDT Amazing %120 Reaction!
📊 Simple Red Box, Extraordinary Results
📊 TIAUSDT | Still No Buyers—Maintaining a Bearish Outlook
📊 OGNUSDT | One of Today’s Highest Volume Gainers – +32.44%
📊 TRXUSDT - I Do My Thing Again
📊 FLOKIUSDT - +%100 From Blue Box!
📊 SFP/USDT - Perfect Entry %80 Profit!
📊 AAVEUSDT - WE DID IT AGAIN!
I stopped adding to the list because it's kinda tiring to add 5-10 charts in every move but you can check my profile and see that it goes on..
Disclaimer: This analysis is for informational purposes only and is not financial advice. Trading involves significant risk. Always do your own research.

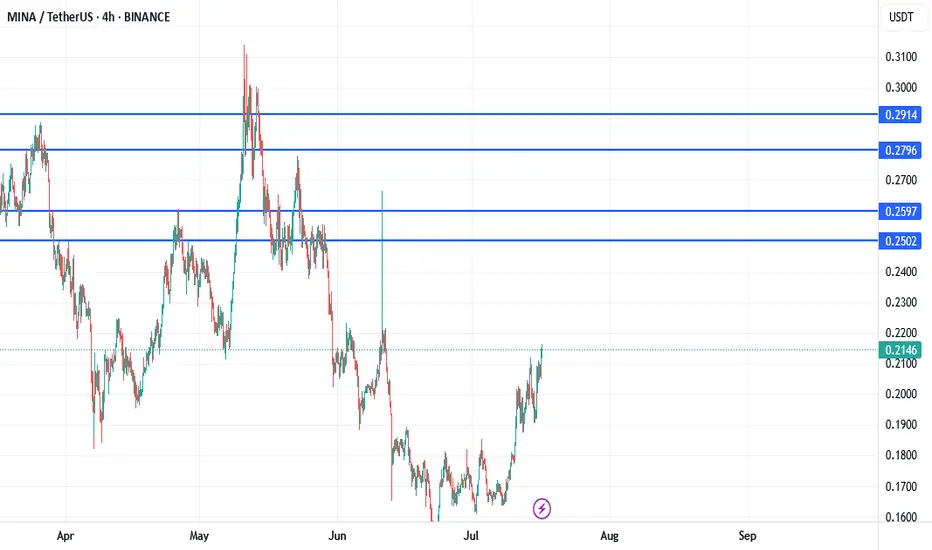
$0.25 is first Target of MINAMina go to the $0.25$ as soon as.
Next target showed in chart.
Thank you
MINA : Is the shedding over ?Hello friends
Given the heavy fall of this and the prolonged price correction, you can now see that the price is supported within the specified support range, which is a good sign...
We have identified important support areas for you, where you can buy in steps and with risk and capital management.
We have also identified targets.
*Trade safely with us*

MINA/USDT. Forgotten Altcoin on the Verge of Exploding”📊 Technical Analysis Overview
A large cup pattern is forming on the higher timeframes.
The structure shows an expanding triangle in the accumulation zone — typical of a final phase before a major move.
🔸 Key Resistance Zones:
$0.80–$0.90 — strong local resistance
▫️ First major barrier
▫️ Possible fake breakout or retest before continuation
$2.60–$3.72 — macro target
▫️ Aligns with the upper boundary of the expanding triangle
▫️ Matches the projected target area of the cup pattern
▫️ This could be the final destination of a larger impulsive move
🔹 Fundamental Context:
This asset had massive hype during the previous bull cycle.
Crowd expectations ranged from $40 to $100 ), leading to a classic overvaluation and eventual wipeout.

MINAUSDT 1D AnalysisMINA ~ 1D Analysis
#MINA Maybe you can consider starting to buy back from here with a short term target of at least 10%+ from here and a long term target of $1
Mina!It's the level I expect to come, both due to a drop in bitcoin and an increase in the amount in circulation over time.
Lower levels are an opportunity to add.

MinaReady for big pump
Breakout ma 💯 and pullback it and now ready for growing to ma 200.
Smart money inflow.
Head and shoulder pattern in daily.

MinaFor ShortTerm expectation. Price go and back between mitigations but bullish mitigation stronger than bearish that is why mina should explode to up

MINAUSDT 1D AnalysisMINA ~ 1D Analysis
#MINA Buy gradually from here if you still have a Conviction on this coin with a short -term target of at least 15%+ from here.

MINA/USDT Technical Analysis – 4H TimeframeMINA has broken out of a classic falling wedge pattern, indicating a potential bullish reversal. The breakout above the upper trendline suggests growing momentum and buyer interest.
✅ Key Highlights:
Price successfully broke the wedge resistance around $0.2142, confirming a bullish breakout.
Current price action near $0.2588 shows strength with no major signs of exhaustion yet.
The projected target based on the pattern is around $0.38.
A logical stop-loss can be placed near $0.18, just below the previous swing low and the wedge support.
📈 Conclusion:
If momentum continues, MINA has room for further upside. A pullback to retest the breakout zone may offer a safer re-entry opportunity.

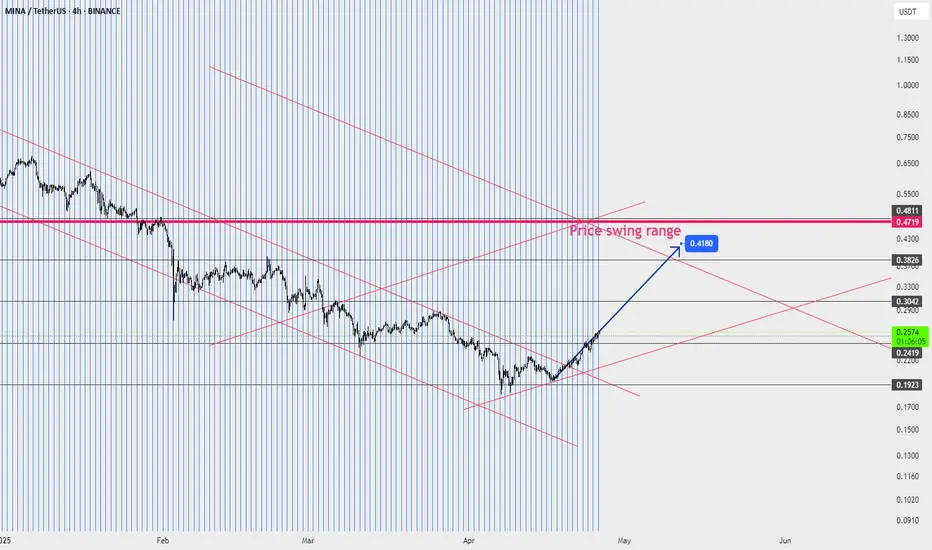
MINAIn my opinion, buying profits from any support level for spot trading can continue up to the price swing range I specified on the page, and of course, this is my opinion and the market maker is someone else.
SPOT MINA LONG 13.04.2025Pinning after abnormal purchases.
💰I enter at the market price.
I'll let you know when I record it manually.
‼️Risk per trade: 0.5% of the allocated funds for spot trading.
Thank you!

$MINA Approaching Decision Zone – Reversal Incoming?📊 Market Structure Update
CSE:MINA has been stuck in a descending channel for months, maintaining a bearish structure.
However, a falling wedge is forming near key support—a classic bullish reversal signal.
🔍 What’s Next?
A breakout from this pattern could shift momentum and ignite a strong rally.
Rejection here might extend the downtrend further—confirmation is key!
🚀 Traders, are you watching this setup? Drop your thoughts!

Mina 1000% in a yearsometime in the end of 2025, Mina is going to be around 2.6$
**im just a newbie learning charting**

MINAUSDT 1W🩸 CSE:MINA ⁀➷
#MinaProtocol. Macro chart Another
💯 Intermediate Target - $1.95
🚩 Macro Target 1 - $3.00
🚩 Macro Target 2 - $5.30
🚩 Macro Target 3 - $9.00
- Not financial advice, trade with caution.
#Crypto #MinaProtocol #MINA #Investment
✅ Stay updated on market news and developments that may influence the price of MinaProtocol. Positive or negative news can significantly impact the cryptocurrency's value.
✅ Exercise patience and discipline when executing your trading plan. Avoid making impulsive decisions driven by emotions, and adhere to your strategy even during periods of market volatility.
✅ Remember that trading always involves risk, and there are no guarantees of profit. Conduct thorough research, analyze market conditions, and be prepared for various scenarios. Trade only with funds you can afford to lose and avoid excessive risk-taking.

MINA ANALYSIS📊 ##MINA Analysis
✅There is a formation of Descending triangle pattern on weekly chart. Also #MINA is trading around its all time low level. If the price sustains here and give a bullish move then we could expect a bullish move otherwise we would see more dip.
👀Current Price: $0.3220
⚡️What to do ?
👀Keep an eye on ##MINA price action and volume. We can trade according to the chart and make some profits⚡️⚡️
##MINA #Cryptocurrency #TechnicalAnalysis #DYOR

SPOT MINA LONG 28.02.2025Pinning after abnormal activity.
💰I enter at the market price.
I'll let you know when I record it manually.
‼️Risk per trade: 1% of the allocated funds for spot trading.
Thank you!

LongAccording to the analysis of the waves and the use of the Gann method and price data analysis, it seems that we can expect the price to return to the green zone on the chart.
This analysis is only my personal opinion. Please do not set your own trading criteria and act based on your personal strategy.
Be successful and profitable

Mina protocol. MYou can see the divergence chain of the Mina currency on the monthly time frame, which can lead to a huge growth with this currency.

SPOT MINA LONG 27.01.2025Pinning after containment of sales.
🎯Purpose:
0.5537
I'll let you know when I record it manually.
‼️Risk per trade: 1% of the allocated funds for spot trading.
