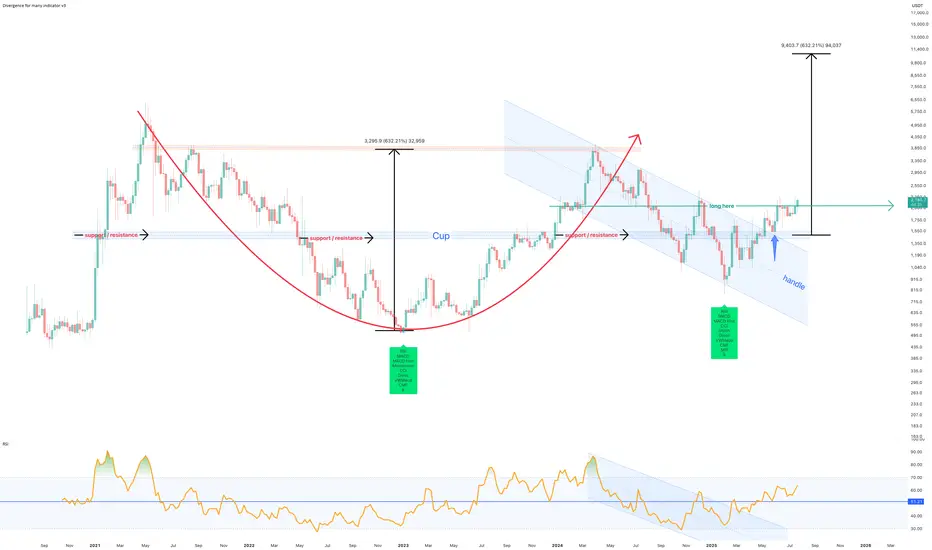
July 2025 - Marker DAO (MKR) to $10k before EthereumThe above forecast is predicted to strike before October 2025. Ethereum will never reach $10k in its lifetime, which a study for another post.
A 75% correction is shown on the above 6 day chart that began in March 2024. A number of compelling reasons now exist for a strong upward move.
Support and resistance
Look left, price action confirms support on past resistance, which follows a strong positive divergence. The resistance has held since May 2022. Incidentally on the topic of divergences, on the same time frame with the same settings, Ethereum prints a double negative divergence over the same period. (see below).
The trend
Both Price action and RSI resistances have broken out. RSI confirms a trend reversal on past resistance.
A Cup and Handle pattern confirmation
The forecast is derived from the Cup and Handle pattern topping out at around $10.5k, however it is not suggested to wait until this area before profits are taken.
Is it possible price action continues to print lower lows? Sure.
Is it probable? No.
Ww
Ethereum 6 day double negative divergencies
MKRUST trade ideas
MKR Break Triangle PatternMKR break triangle pattern ? but please wait till closed candle today, if we closed above trendline we have big possibliity surge to around 2.3k
if we close below trendline we can sideways or maybe dump to 1.7k

MKRUSDT UPDATE
Pattern: Falling Wedge Breakout
Current Price: \$2,018.7
Target Price: \$3,250
Target % Gain: 62.49%
Technical Analysis: MKR has broken out of a falling wedge pattern on the 12H timeframe with a strong bullish candle and volume spike, indicating momentum shift. The breakout confirms a potential rally toward the \$3,250 target.
Time Frame: 12H
Risk Management Tip: Always use proper risk management.

MKR ANALYSIS🔮 #MKR Analysis
🌟🚀 As we said earlier #MKR moved around 48%. Right now #MKR is trading in an Ascending Triangle Pattern and here we can see that #MKR moving again towards its neckline. We see see more bullish move in upcoming days
🔖 Current Price: $2260
⏳ Target Price: $2664
⁉️ What to do?
- We have marked crucial levels in the chart . We can trade according to the chart and make some profits. 🚀
#MKR #Cryptocurrency #Breakout #DYOR

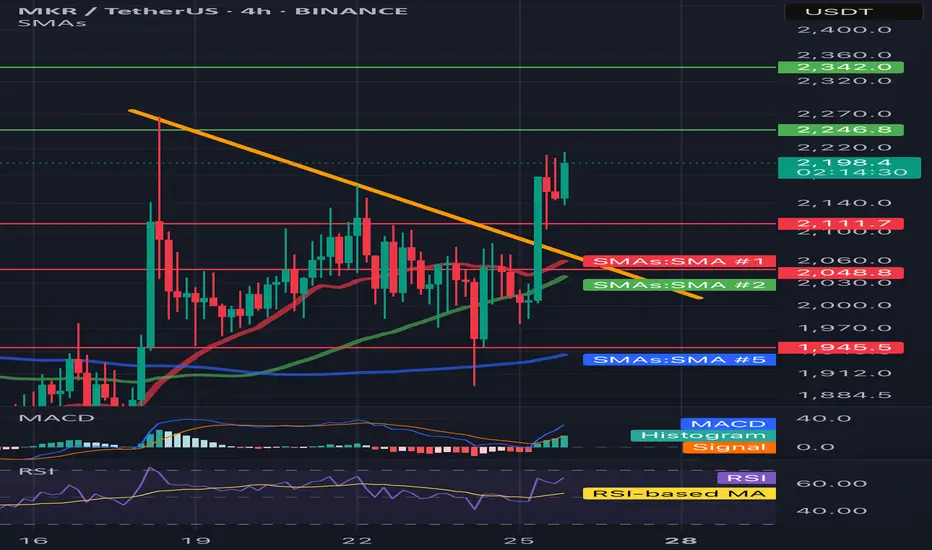
MKR/USDT 4H📈 Trend and price structure
• The price has just been above the downward trend line (yellow line), which suggests the potential reversal of the trend to the upward.
• Breaking was strong - a candle with a large growth volume and an increase +9.13%, which emphasizes the pressure of buyers.
⸻
🔍 levels of support and resistance
• resistance:
• ~ 2342 USDT - a clear level of resistance (green line) - may be the target for the next upward movement.
• 2246.8 USDT - first resistance to overcome.
• Support:
• 2111.7 USDT - level of local support after struggling (earlier resistance).
• 2048.8 USDT - SMA #1 (red medium), can be support at the back.
• 1945.5 USDT - strong support in the form of long -term SMA (blue line, SMA #5).
⸻
📊 Technical indicators
✅ MacD (below)
• The MacD line cut the signal line up - buy signal.
• The histogram is growing, which confirms the growth moment.
✅ RSI
• RSI has bounced from level 40 and is currently above 60 - it suggests upward momentum, but it is not yet purchased, so there may be room for further growth.
⸻
✅ Medium walking (SMAS)
• The price was pierced by SMA #1 (red) and SMA #2 (green) with impetus, which means a change in sentiment.
• If it stays above these medium - a bull signal.
• SMA 50 (green)> SMA 200 (blue) = potentially a golden cross is formed on a longer TF.
⸻
📌 Summary - technical scenario:
🐂 Bycza scenario:
• If the price lasts above 2111.7 USDT, it may continue to increase to USDTt and further up to $ 2,342.
• Confirmation will be the continuation of growth on MacD and RSI over 60-70.
🐻 Bear scenario (threats):
• If the price drops below 2048 USDT, possible correction up to 1945 USDT.
• RSI returning below 50 and Macd Cross down would be a reversal signal.
MKR – Bull Pennant Breakout, Eyes on $3000Breakout Confirmation:
MKR has broken out of a daily bull pennant, signaling bullish momentum. The breakout candle reclaimed key HTF S/R (~$1987–$2000 zone) and flipped it to support.
Entry and Risk Zone:
Ideal long entries are on retests of this S/R flip ($1987–$2000). Invalidation below $1826 (recent low and support).
Upside Target:
First target at $2759, full target at $3000 zone, just below the marked supply.
Trade Management:
Trailing stops recommended as price approaches $2750–$2800 to lock in gains.
MKR just broke out of a clean daily bull pennant pattern, confirming a structural shift with a retest and reclaim of high timeframe S/R. This level, previously strong resistance, now acts as support. Combined with the breakout and the momentum from recent market dips, the setup favors continuation to the upside with $2750–$3000 as the likely destination. Failure to hold $1826 invalidates the bullish scenario.

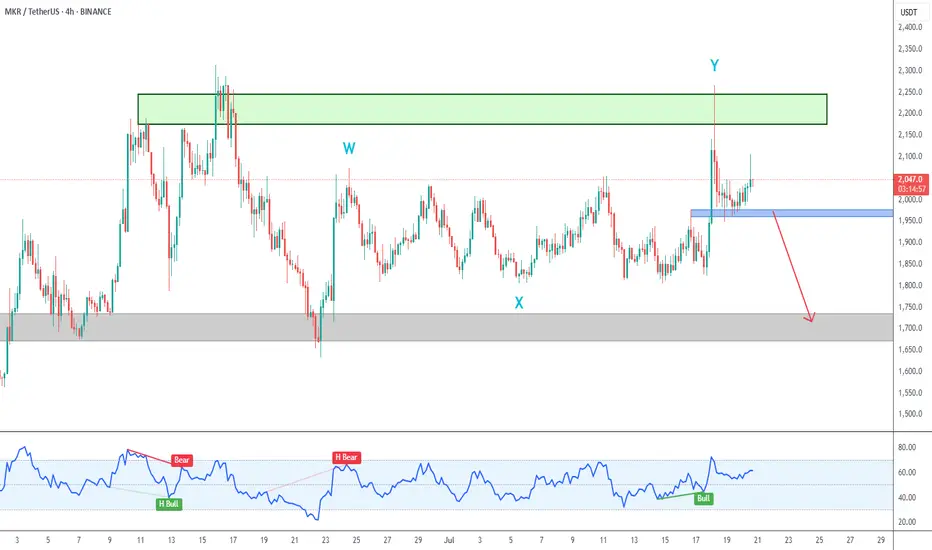
MKR 4h Chart Analysis
On the 4H Chart the 2,200 supply zone proved to be too strong for bulls, and there was a strong rejection.
My primary count considers that was wave Y, and I´m currently neutral to bearish.
A break of blue support zone around 1,970 should take us to another retest of 1,700 support.
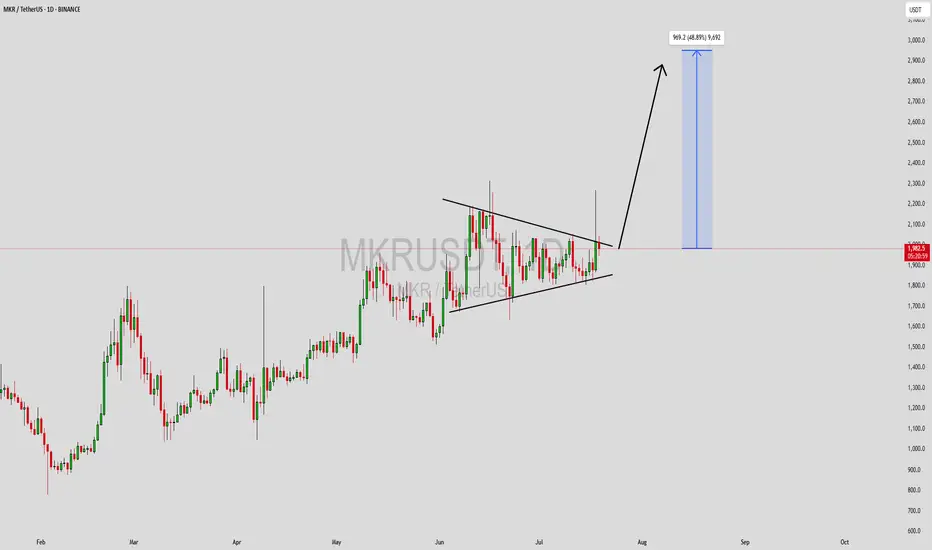
MKRUSDT Forming Symmetrical TriangleMKRUSDT has formed a textbook symmetrical triangle pattern on the daily chart, a classic consolidation structure that often precedes a strong breakout. The price is currently pressing against the upper resistance line, and a breakout above this range could trigger a bullish continuation toward the $2,900 level, suggesting a potential gain of 30% to 40%+. The rising volume on the recent candles confirms that traders are positioning themselves ahead of a possible move, making this setup highly watchable for swing traders.
Maker (MKR), being a major governance token in the DeFi ecosystem, continues to attract interest due to its role in the MakerDAO protocol and its connection to the DAI stablecoin. As DeFi fundamentals remain strong and institutional capital slowly returns to decentralized finance platforms, MKR is likely to benefit from renewed attention. This breakout could be a reflection of that growing confidence.
The bullish sentiment is further supported by strong fundamentals and technical indicators aligning in favor of upside momentum. With crypto market sentiment gradually improving and altcoins showing signs of strength, MKR could outperform many peers in the coming weeks. Watch for confirmation above the triangle resistance and monitor volume spikes to validate a strong entry.
✅ Show your support by hitting the like button and
✅ Leaving a comment below! (What is You opinion about this Coin)
Your feedback and engagement keep me inspired to share more insightful market analysis with you!
$MKR/USDT 4h LONG Swing Setup
Entry: 1893
SL: 1700
TP: 2283
R/R: 2.2
Price rebounding off a strong uptrend line & 200MA support. DeFi momentum +
E
T
H
h
o
l
d
i
n
g
ETHholding3k could fuel the next MKR leg up!
Watching for a MACD reversal confirmation. 📈
Not financial advice. DYOR & good luck! 🔥
#Crypto #Trading #DeFi #MKR #Ethereum #Altcoins

MKR/USDT 4H Chart🔍 1. Technical Pattern:
The chart shows a descending wedge (orange lines) that has broken out upward.
The breakout occurred on increasing volume (a signal of bullish strength).
The price is currently trading above a resistance line, which is now acting as support (~1980 USDT).
📊 2. Support and Resistance Levels:
Support (red lines):
1903 USDT – local consolidation support.
1801 USDT – strong support at the previous bottom.
1727 and 1632 USDT – fallback zones in case of strong declines.
Resistance (green and blue lines):
2120 USDT – first target after the breakout.
2168 USDT – another strong resistance from the previous consolidation.
2312 USDT – high resistance, potential target if the uptrend continues.
📈 3. Indicators:
🔹 Stochastic RSI:
Close to the overbought zone, but not yet giving a sell signal.
A short consolidation or correction may occur in the coming hours.
🔹 MACD:
The MACD line is above the signal and the histogram is still rising – a buy signal.
No signs of weakening momentum.
🔹 RSI:
The RSI is rising, but not yet in the overbought zone (>70).
Shows the strength of the trend, but there is room for further upward movement.
🧠 Summary and scenarios:
✅ Bullish scenario:
If the price remains above 1980 USDT, the next targets are:
2120 USDT
2168 USDT
Potentially 2312 USDT with continued demand
⚠️ Bearish scenario (less likely at this time):
If the price returns below 1980 USDT and does not regain this level:
Possible return to 1903 or lower (1801 USDT).

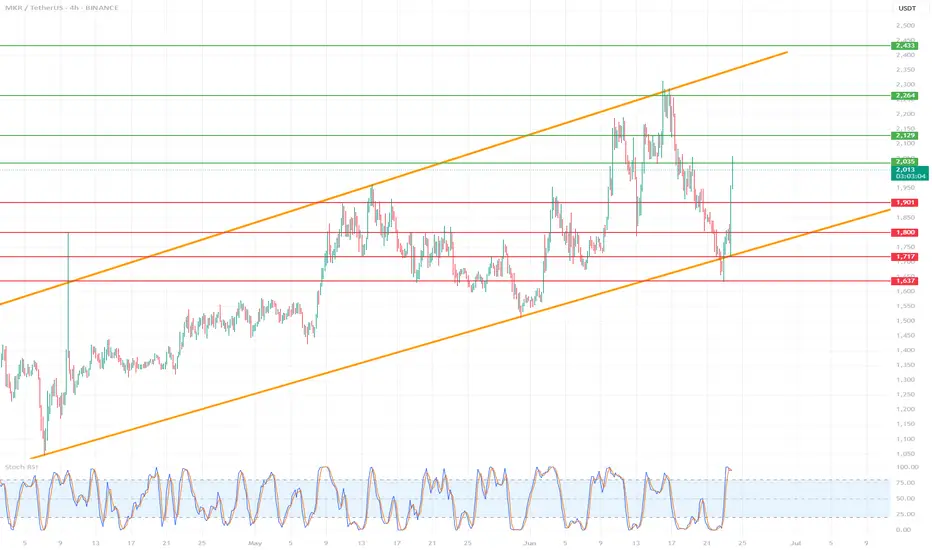
MKR/USDT (MakerDAO) on the 4H time frame🔷 1. Trend and market structure
🔸 Upward channel:
The price is moving in a wide, ascending channel (orange lines).
The lower line of the channel was last tested on June 22, 2025, which ended with a dynamic upward bounce.
The upper limit of the channel reaches around 2,450 USDT.
🕸️ Market phase:
In the short term, the market was in a downward correction phase within the uptrend.
Currently, we see a strong rebound from support - a new uptrend is possible.
🔷 2. Key horizontal levels (support/resistance)
🟥 Support:
1,637 USDT - local support (the lowest level of the red zone), almost tested at the bottom.
1,717 USDT - very technical support, tested several times.
1,800 USDT – psychological level and local consolidation.
1,901 USDT – last support peak, currently broken upwards.
🟩 Resistances:
2,003 USDT – current price level, currently tested as new resistance.
2,129 USDT – strong resistance from previous peaks.
2,264 USDT – previous swing high.
2,433 USDT – upper boundary of the channel and technical level from historical peaks.
🔷 3. Price and candle behavior
Strong demand reaction at the lower boundary of the channel: long pin bar/bull's embrace at the lower boundary.
The upward movement was dynamic and uniform, which indicates high buyer activity.
If the price stays above 1,901 USDT – further increases are possible.
🔷 4. Technical indicators
🔁 Stochastic RSI (4H):
Currently in the overbought zone, just below the level of 100 - a temporary correction or consolidation may occur.
However, with a strong upward trend, Stoch RSI may "stick" to the upper band - it does not yet give a clear S/S signal.
🔷 5. Technical scenarios
🟢 Bullish scenario (continuation of growth):
Condition: maintaining the level above 1,901 USDT.
Targets:
TP1: 2,129 USDT
TP2: 2,264 USDT
TP3: 2,433 USDT (upper limit of the channel)
Stop-loss: below 1,800 USDT
🔴 Bearish scenario (rejection of resistance):
Condition: strong rejection of 2,003 USDT and return below 1,901
Targets:
TP1: 1,800 USDT
TP2: 1,717 USDT
TP3: 1,637 USDT
SL: return above 2,003 USDT
🔷 6. Final remarks
The current upward movement looks like a "V-shape reversal" reaction - a sharp turnaround with dynamic volume suggests strong buyer interest.
The key will be the reaction to 2,003 USDT - a breakout and retest can give a very good long entry.
Short positions are risky as long as the price is in the lower half of the ascending channel.
#MKR/USDT#MKR
The price is moving within a descending channel on the 1-hour frame, adhering well to it, and is heading toward a strong breakout and retest.
We are experiencing a rebound from the lower boundary of the descending channel. This support is at 2008.
We are experiencing a downtrend on the RSI indicator, which is about to break and retest, supporting the upward trend.
We are heading toward stability above the 100 moving average.
Entry price: 2333
First target: 2201
Second target: 2097
Third target: 2333

#MKR/USDT Ready to launch upwards#MKR
The price is moving in a descending channel on the 1-hour frame and is adhering to it well and is heading to break it strongly upwards
We have a bounce from the lower limit of the descending channel, this support is at a price of 1200
We have a downtrend on the RSI indicator that is about to be broken, which supports the rise
We have a trend to stabilize above the moving average 100
Entry price 1243
First target 1270
Second target 1311
Third target 1356

Maker (MKR)MKR usdt Daily analysis
Time frame 4hours
Risk rewards ratio =2 👈👌
Target 2400$
Now is a good opportunity to break the 1930$ resistance and reach to the next resistance area in 2400$
But if mkr can't break this resistance, will fall down to 1600$

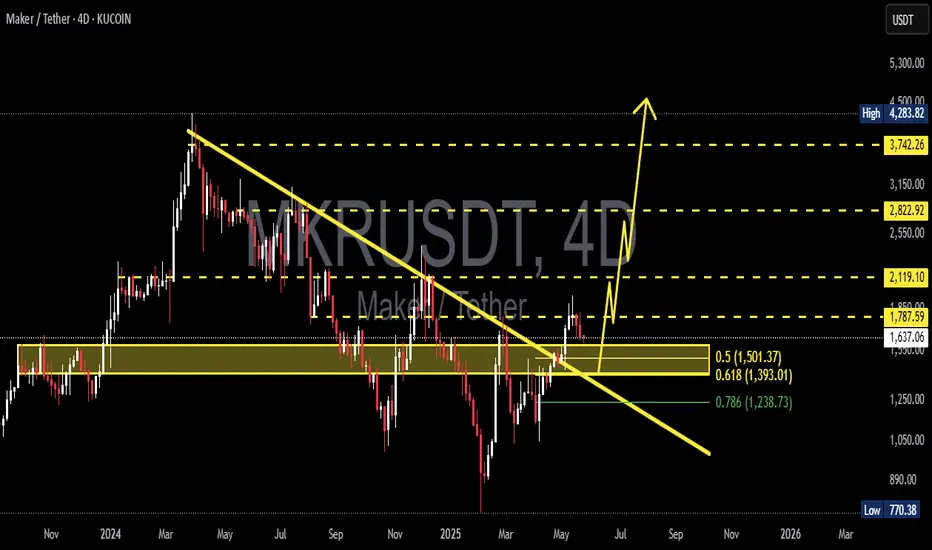
MKR 1W🔍1. Overall Trend:
In the long term, we can see that MKR was in a downtrend, as evidenced by the falling trendline (orange dashed line).
The last candles show that the price has broken this downtrend line - this could indicate a potential trend reversal or at least an attempted upside correction.
📊Support and resistance levels (horizontal chart):
Strong support (red) and resistance (green) levels are marked:
✅ Resistances:
~3,770 USDT – local top, very strong resistance.
~3,079 USDT – previous support, now acting as resistance.
~2,002 USDT – current growth barrier, price is currently struggling with this level.
🔻 Supports:
~1,574 USDT – current local support.
~1,248 USDT – next support, previously tested.
~800 USDT and ~400 USDT – historical accumulation zones, deep support levels.
Oscillators (bottom of the chart):
Stochastic RSI – currently in the upper zone, which may suggest that the market is approaching overbought. Possible correction.
RSI (classic) – oscillates around 50, i.e. neutral, but with a slight upward slope. There is no overbought signal yet.
🧠 Conclusions:
➕ Bullish signals (pro-growth):
Break of the downtrend line (may be the first signal of a trend change).
Formation of a higher low.
Oscillators are not yet in the extreme zone.
➖ Bearish signals (pro-fall):
The price has not yet managed to break the resistance at 2,002 USDT.
Stochastic RSI indicator close to the overbought zone - possible short correction.
📌 Scenarios:
1. Upside scenario:
If the price breaks through the 2,002 USDT level and stays above it, the next target will be the 3,079 USDT level.
Confirmation will be the rising RSI and staying above the trend line.
2. Downside scenario:
If the price fails to break through the 2,002 USDT level and falls below the 1,574 USDT level, a possible test of the 1,248 USDT level or even lower (800 USDT).

MKR – Weekly Channel Breakout, Daily Rising Wedge📈 GATEIO:MKRUSDT has broken out of a long-term descending channel on the weekly chart, and the retest is holding so far — a sign of potential strength.
🔹 On the daily timeframe, price action is forming a rising wedge — a structure to watch closely as momentum could build quickly if confirmed.
💡 Risk management is key — safe stop-losses and tight entries are the name of the game here.
👀 Stay alert — this one is heating up!

MKRUSDT 1D AnalysisMKR ~ 1D Analysis
#MKR Buy on retest of this support block with short term target of at least 10%++ from here.
MKRUSDT 1W#MKR has broken above the descending resistance on the weekly timeframe. Is $4000 on the way?
The technical breakout looks promising.
Consider buying some #MKR between $1687 and $1556.
Targets are:
🎯 $2037
🎯 $2426
🎯 $2815
🎯 $3369
🎯 $4074
⚠️ Use a tight stop-loss.

MKR breakout confirmedSuccessfully breakout this resistant line with a short -term target of at least +20% - 50%

MKR READY FOR PUMP AFTER RETESTMKRUSDT did market shift, as did sweep of previous low liquidity and did BOS. Will look for long positions in marked FVG areas.

Maker ready to go balistic!- trading within what appears to be a descending broadening wedge for the last year
- with ETH likely heading towards at least 2.6k for a mean reversion play, it is very likely Maker is one of the coins that benefit from ETH strength the most
- target of the formation is SUBSTANTIALLY higher

MKR/USDT 4h chart ReviewHello everyone, let's look at the 4H MKR chart to USDT, in this situation we can see how the price moves on the created upward trend line. Going further, let's check the places of potential target for the price:
T1 = $ 1576
T2 = 1657 $
Т3 = 1714 $
Let's go to Stop-Loss now in case of further declines on the market:
SL1 = $ 1529
SL2 = $ 1499
SL3 = $ 1450
SL4 = 1372 $
Looking at the RSI indicator, we see
How slight relaxations give space for further increases by living in the upward trend of price.

SHORT MKR Big 3 shorts looks like appearing big distribution
reflection on a 15 minutes from them
appearing big volumes and divergence with TOTAL3 and BTC ( MKR are not growing instead of them )
