$MKR LONG . Lets try!It is not a good idea to open longs while BTC is falling but mkr looks good.
Let's try with a very very small long
MKRUST trade ideas

MKR looks bullishHi there,
MKR looks very bullish for me. I'll enter at the entry point when BTC make its correction.

MKRUSDT | Bearish Trend Continuation | Descending TriangleMKRUSDT is showing Bearish Trend Continuation forming Descending Triangle along with the price synced with the RSI. We will place sell stop order along with SL and TPs.

$MKR LONG , Fast scalpQuick trade in futures to scratch some profit at MKR.
we will use the rebound in its discount zone (where it is right now).
Surely we will cut this trade in profit before reaching target
Let's say it's a trade just for the weekend when the CME is closed for BTC.


Maker support and resistanceif you take a look at the lines i have drawn use them to DYOR and see how fvg are filled and used as liquidity zones by the market makers

MKR breakout conformationmkr and yfi are decentralized banks both are running mkr has confirmed on the daily TF above the trendline and based on the playout of oct this path is looking the same targets on chart

MKRUSDT IdeaMKRUSD - MKRUSDT - BINANCE:MKRUSDT COINBASE:MKRUSD
✅ ✅ Risk warning, disclaimer: the above is a personal market judgment and analysis based on published information and historical chart data on The trading view,
And only some of these analyzes are my actual real trades.
I hope Traders consider I am Not responsible for your trades and investment decision.


MKR SHORTLooking at a short on MKR, The charts seem to be having some action at this area, I want to be in and out for a 1:2 profit in a week o so

MKRUSDT Short Setup!MKRUSDT Technical analysis update.
Short level : Above $855
Stop loss : $890
Take Profit 1 : $825
Take Profit 2 : $765
Take Profit 3 : $705
Thanks
Hexa

Mkrusdt long & short Mkrusdt moving rapidly after creating a relative double bottom on the weekly tf
But if btc should dump a little mkr might probably retrace back to the weekly OB thereby making the double bottom leveled before it impulse move or massive correction
NOTE :bitcoin determine altcoins move DYOR

$MKRUSDT, BREAK DOWN, SHORT! 8% GAIN, 2% RISKprice resisted again at supply zone, potential 8% gain or 2% loss, RRR 1:4, entry 930.00, Target profit 850.00

MKRUSDTVery Bullish on MKR personally i am long here, Daily closing above 980$ will be the confirmation to 1130$ and Closing above 1130$ will be confirmation to 1600$ zone.
#DYOR

MKR ShortPotential short opportunity on MKR, the idea behind a 1188 entry is to get in on the position before the 1200 whole number level,

MKRUSDTHello dear friends
Due to the negative divergence of the RSI in the daily time frame, the possibility of completing the bullish wedge pattern at the end of the uptrend has been strengthened.
🔍 If the range of $719 is completely consumed, the possibility of reaction to the range of $806 will be strengthened and we can expect the continuation of the downward trend to the range of $605 and $536.
❗️❗️❗️ Note that if the $932 resistance range is completely consumed, the above view will expire.
We would be happy to hear your comments

MKR pushing higherNot sure if the news of owner of MakerDAO selling LDO to buy MKR played a role in this pump but MKR is pumping over a resistance zone (former resistance now that has been passed) and from my point of view, if the daily will close in this way, there are two possible zone where this can stop: that local high and the OB up there. I chose to take in account the overlapping of those two OB.
Off course my reasoning makes sense ifBTC doesn't dump tomorrow. It's currently in a very tight range so anything can happen but I'd expect some green before going lower.
On 1h chart the push upward seems consolidated so at least price will take that high.
Once we see a reversal pattern we can look to open a short position (I'll post updates). I wouldn't long now but once the local high is taken if the signs are good we can take the long.
Good luck

SasanSeifi 💁♂️TA: MKR_USDT / 3D LongTerm⏭ 1170/ 1000❗HI TRADERS ✌The possible scenario of MKRUSDT is specified. As you can see, in the 3-day time frame, after the price fluctuations, it faced growth up to the range of 970. It is currently trading in the range of 919. We can expect that if the price penetrates above the range of 960 and stabilizes, the possibility of growth up to the range of 1170 can be considered. We have to see how the price will react.
It is important to maintain the support range of 750/800.
let's see...
❎ (DYOR)...⚠⚜
WHAT DO YOU THINK ABOUT THIS ANALYSIS? I will be glad to know your idea 🙂✌
IF you like my analysis please LIKE and comment 🙏✌

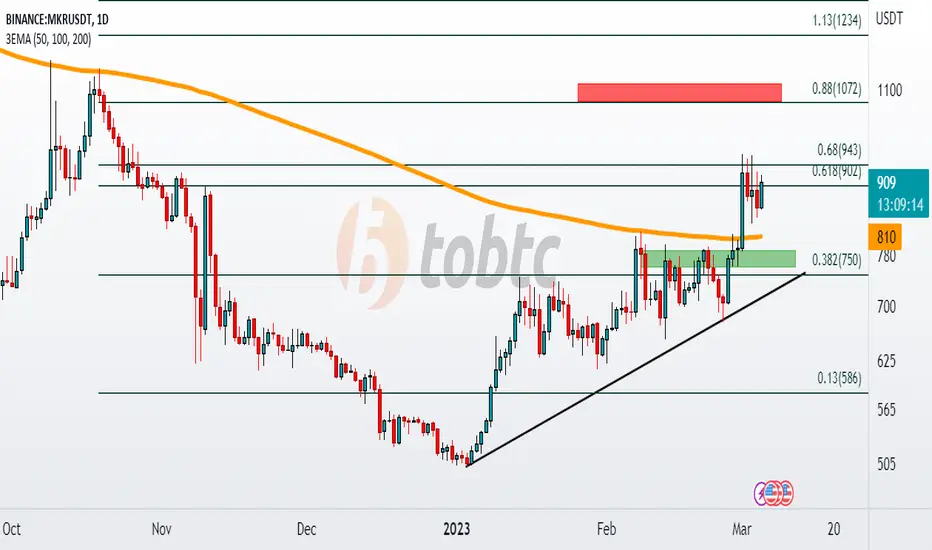
#MKRUSDT #LQRUSDT #TOBTC #LaqiraProtocolIf the price range of $940 breaks and stabilizes above it, we expect the price to rise to the range of $1072
minor support $840
important dynamic support EMA200 at price $810
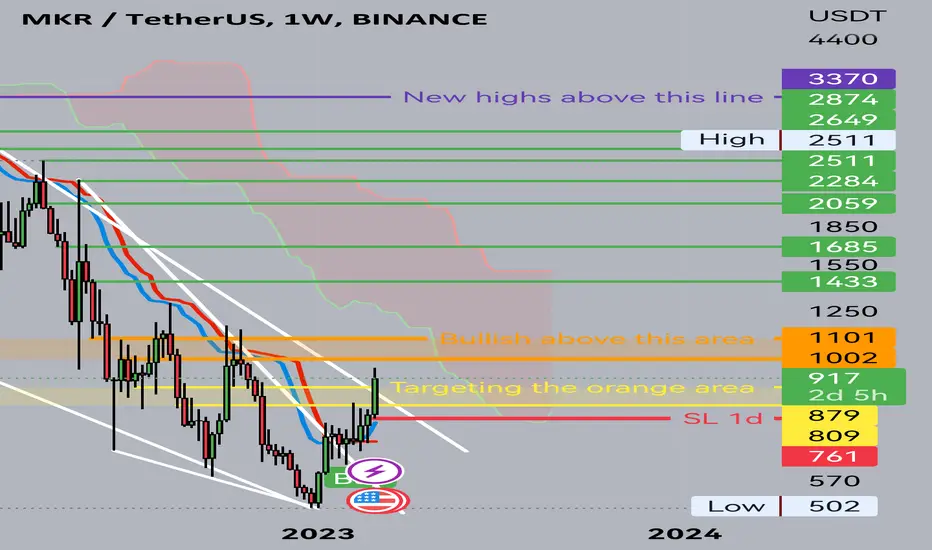
MKR 1w is very bullish if... If MKR manages to stay above the yellow area, then it will target the orange area.
If it stays 1w above the orange, then it is very possible to see a good rally to reach the purple line for new highs.
It has a falling wedge pattern and we can see a breakout already in this area.
SL is 1d below the red line
All the best insha Allah!
MKR/USDT Golden Cross Golden Cross Accrued on Binance 1d Chart pattern of MKR /USDT Pair 50 EMA Cross 100 Ema Next Support and Resistance Available , if you have your idea about MKR Please share with us.

Will Maker Continue Its Rebound?Maker has rebounded recently, but how stable is this renewed bull run?
What is Maker? Maker (MKR) is a decentralized cryptocurrency that operates on the Ethereum blockchain. It is a governance token used to manage the MakerDAO platform, which is a decentralized finance (DeFi) protocol. MKR has experienced some recent market trends and developments, so let’s the potential growth prospects of this cryptocurrency.
MKR's Rally
MKR has started rebounding from the descending channel that it has been stuck in since May 2021. It broke from its descending trendline it has been stuck in since August 2021, and crossed above the 200 Simple Moving Average (SMA), which acts as mobile support and resistance. These two indicators suggest MKR has turned bullish, and investors should keep an eye on this cryptocurrency.
While MKR had a big day on Wednesday when it increased by 17%, it is unclear whether this strong rally will continue. Currently, MKR is slightly overbought, which means that the price may start to drop or range. Historically, each time MKR reached overbought levels on the Relative Strength Index (RSI), it started falling or ranging. However, it's essential to keep in mind that the RSI can be overbought for a few days, so it doesn't mean that it will change its current trend immediately.
Support and Resistance
If MKR starts retracing, the $700 and $500 support levels are ready to step in and halt the retracement. These support levels have been significant in the past and have helped to stabilize MKR during bearish phases.
On the other hand, if the rally continues, the next resistance stands at $1,700. This level has been a significant support in the past. If MKR manages to break above it, it could lead to further growth in the cryptocurrency's price.
Bottom Line: MKR recently rebounded from the bear market and crossed above the 200 SMA, suggesting that the cryptocurrency may be turning bullish. However, it is uncertain whether this rally will continue, and investors should keep an eye on the support and resistance levels mentioned above.

$MKRUSDT, POTENTIAL 6% GAIN, SHORTINGBreak down from Gann Box and 100ma, Potential 5% gain with 1:3 Risk Reward Ratio.
