$MKR Short IdeaWe are seeing another lower high being made with the strong rejection on the 200EMA on the 6H time frame. Looking for a breakdown into a new lower low around ~1,000
MKRUST trade ideas

MKRUSDTmy entry on this trade idea is taken from a point of interest above an inducement (X).. I extended my stoploss area to cover for the whole swing as price can target the liquidity there before going as I anticipate.. just a trade idea, not financial advise
Entry; $01390
Take Profit; $1267
Stop Loss; $1429

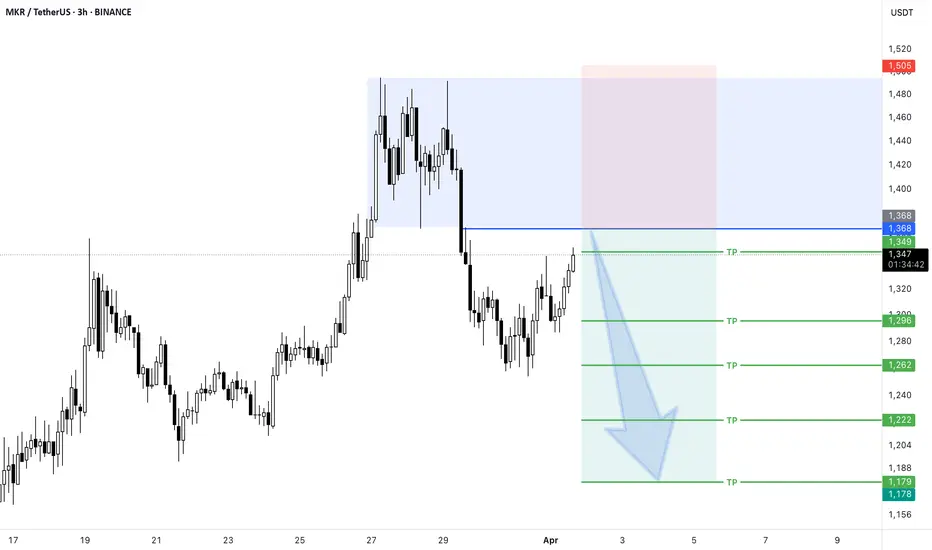
Short Position MKR/USDT#Singal
MKR/USDT
🔴 Short Position
🎲 Entry @ 1,368
✅ Target1@ 1,349
✅ Target2 @ 1,296
✅ Target3 @ 1,262
✅ Target4 @ 1,222
✅ Target5 @ 1,179
❌ Stop Loss @ 1,505
Leverage: 5X_15X
Margin: 10% of Wallet Balance
⚠️"Take Care of Risk Management for Your Account"
MKR Looks Bearish (1D)The correction of MKR seems to have started from the point marked START on the chart.
This correction appears to be a diametric pattern, and we are now in the late stages of wave F, which has been a bullish wave.
It is expected that from the red zone, wave G a bearish wave will begin.
The closure of a daily candle above the invalidation level will invalidate this analysis.
For risk management, please don't forget stop loss and capital management
Comment if you have any questions
Thank You

MKRUSDTmy entry on this trade idea is taken from a point of interest below an inducement (X).. I extended my stoploss area to cover for the whole swing as price can target the liquidity there before going as I anticipate.. just a trade idea, not financial advise
Entry; $1185
Take Profit; $1281
Stop Loss; $1154

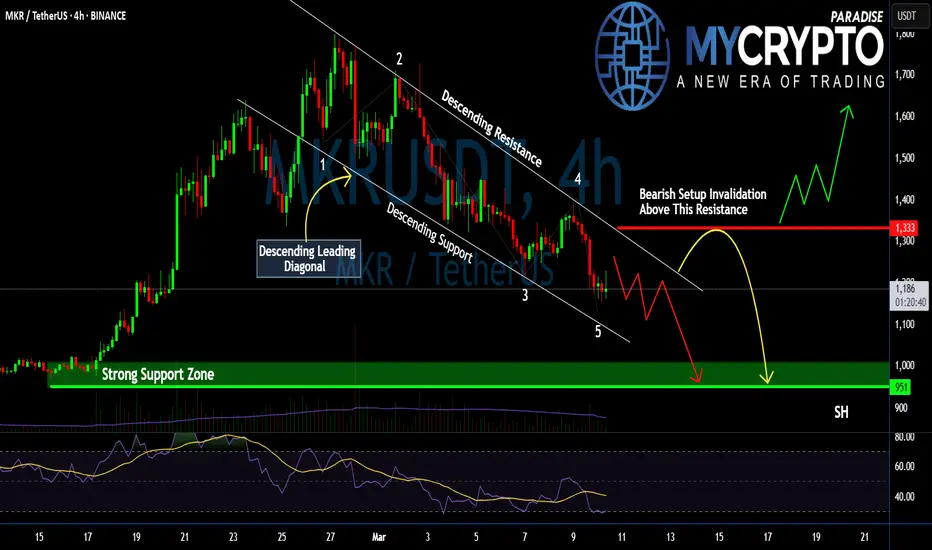
#MKR Bears in Control: Is a Breakdown Inevitable or Not?Yello, Paradisers! Is #MKR setting up for another leg down, or will the Bulls finally step in? The structure is clear; this could get ugly unless something changes soon. Let’s break down the #Maker setup:
💎#MKRUSDT is forming a Descending Leading Diagonal, a classic bearish pattern within a larger zigzag correction. This structure suggests that sellers remain in control, with each bounce being met by renewed selling pressure.
💎Price is currently reacting off the descending support near $1,160. While a short-term bounce toward $1,250 - $1,300 is possible, it remains within the bearish framework. The critical resistance to watch is at $1,333—a breakout above this level would invalidate the bearish setup and signal a shift in momentum.
💎If the bearish structure holds, the next leg down could take us to the strong support zone at $1,000 - $950. This is where buyers will have their last real chance to defend the trend. A failure to hold this level could open the door to a deeper correction.
💎RSI remains weak, showing no strong bullish divergence, signaling that momentum is still in favor of the sellers. The volume is declining, meaning the recent price action lacks strong buying conviction.
Strive for consistency, not quick profits. The market rewards discipline and patience—trade smart, Paradisers!
MyCryptoParadise
iFeel the success 🌴

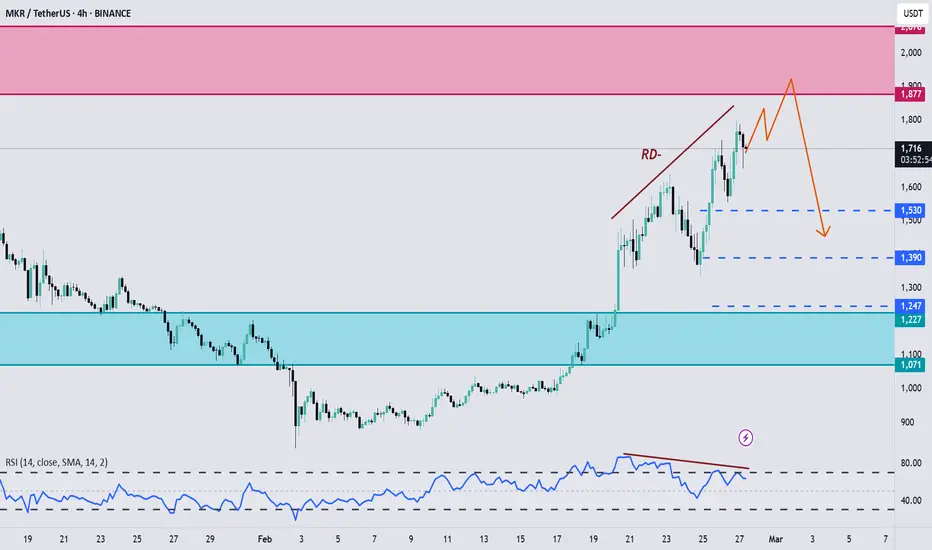
MKR, Ready for a short opportunity !!!Hello Traders, Hope you are doing great.
After a good upward movement that happened in last weeks, now it seems that bulls are going to lose their control and we'll probably see a downward correction after the price reaches to the specified supply zone, we also have regular divergences on 4H and Daily timeframes.
So for upcoming days I expect a slowly upward movement at first and after that Bears step in and cause a downward correction happen. Targets have determined by Blue dashed lines.
And finally Tell me What are your thoughts about MKR ? UP or DOWN ? comment your opinion below this post.
MKR Correction
MKR is one of the better looking altcoins out there, currently correcting an impulsive wave which began early February.
I'll be looking for long trades in smaller timeframes once price hits the 50% pullback.
Strong gray resistance held price on the first try, but I believe it will be at least retested

UniversOfSignals | MKRUSDT 70% Move?Let's analyze and review one of the best coins in the DAo area together and find another entry point together and update our previous triggers
🌐 Overview Bitcoin
Before starting today's altcoin analysis, let's look at Bitcoin on the 1-hour timeframe. Since yesterday, Bitcoin experienced a correction, which was necessary for the market, and it pulled back to the 102135 range. The next trigger for a long position will be a breakout above 104714.
Yesterday's correction, coupled with an increase in Bitcoin dominance, caused noticeable declines in some altcoins. This highlights the importance of monitoring BTC pairs in your checklist these days.
MakerDAO’s sharp increase in fees and growth in Total Value Locked (TVL) has fueled demand. On February 20, $156.77 million of MKR was burned, reducing supply. Growth in active addresses and trading volume has driven the price higher. Strong resistance at $1,800 may limit further growth. MakerDAO’s emergency offering has raised concerns about $3.1 billion USDC exposure.
📊 Weekly Timeframe
In the weekly timeframe, the token has seen a 95% gain on the coin, which is a good sign in these market conditions!
Also, in this timeframe, we are in an opening triangle, which is characterized by high volatility, and we are constantly moving towards the bottom and top of this triangle, regardless of the ceiling and floor or support and resistance, and the exit from this triangle will also be sharp.
In this timeframe, we did not have a trigger in advance to say that we could buy or anything else, and it moved very sharply. If you lose, it is normal and do not blame yourself and your strategy.
After exiting this triangle and breaking 2.182, we can have a good trigger to buy, and for now, if you bought and held during this fluctuation and are in profit above 50%, it is logical to save profit, but if you did FOMO and bought, it is better not to continue trading and be busy watching the tutorial for now.
📝 Final Thoughts
Stay calm, trade wisely, and let's capture the market's best opportunities!
This analysis reflects our opinions and is not financial advice.
Share your thoughts in the comments, and don’t forget to share this analysis with your friends!

TradeCityPro | MKRUSDT 70% Move?👋 Welcome to TradeCityPro Channel!
Let's analyze and review one of the best coins in the DAo area together and find another entry point together and update our previous triggers
🌐 Overview Bitcoin
Before starting today's altcoin analysis, let's look at Bitcoin on the 1-hour timeframe. Since yesterday, Bitcoin experienced a correction, which was necessary for the market, and it pulled back to the 102135 range. The next trigger for a long position will be a breakout above 104714.
Yesterday's correction, coupled with an increase in Bitcoin dominance, caused noticeable declines in some altcoins. This highlights the importance of monitoring BTC pairs in your checklist these days.
MakerDAO’s sharp increase in fees and growth in Total Value Locked (TVL) has fueled demand. On February 20, $156.77 million of MKR was burned, reducing supply. Growth in active addresses and trading volume has driven the price higher. Strong resistance at $1,800 may limit further growth. MakerDAO’s emergency offering has raised concerns about $3.1 billion USDC exposure.
📊 Weekly Timeframe
In the weekly timeframe, the token has seen a 95% gain on the coin, which is a good sign in these market conditions!
Also, in this timeframe, we are in an opening triangle, which is characterized by high volatility, and we are constantly moving towards the bottom and top of this triangle, regardless of the ceiling and floor or support and resistance, and the exit from this triangle will also be sharp.
In this timeframe, we did not have a trigger in advance to say that we could buy or anything else, and it moved very sharply. If you lose, it is normal and do not blame yourself and your strategy.
After exiting this triangle and breaking 2.182, we can have a good trigger to buy, and for now, if you bought and held during this fluctuation and are in profit above 50%, it is logical to save profit, but if you did FOMO and bought, it is better not to continue trading and be busy watching the tutorial for now.
📝 Final Thoughts
Stay calm, trade wisely, and let's capture the market's best opportunities!
This analysis reflects our opinions and is not financial advice.
Share your thoughts in the comments, and don’t forget to share this analysis with your friends!

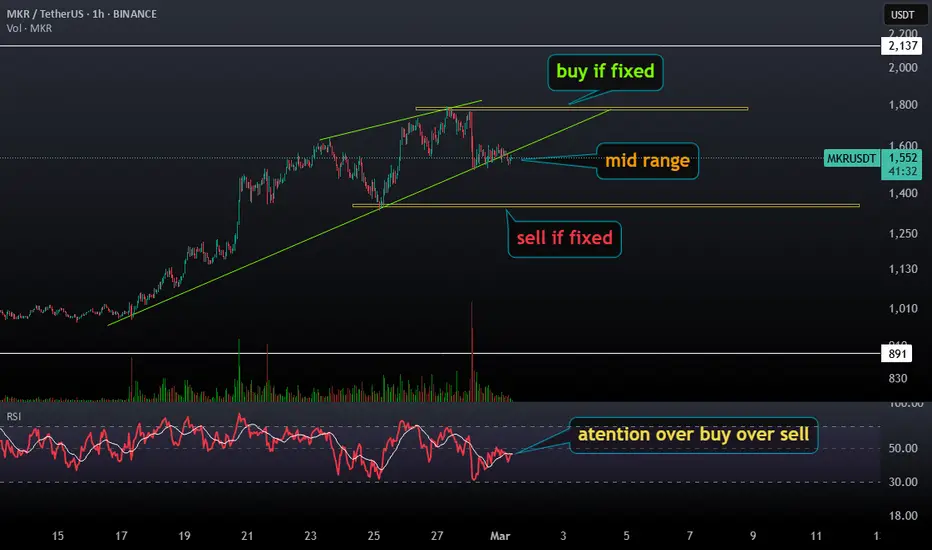
MKR"Based on the market, identify your position for buying or selling and enter with a good and logical stop-loss. Given the low volume, you should wait for a movement in either direction."
MKRUSDTWe can attempt to buy MKRUSDT from specified level as it make HL , also there is no bearish divergence occur indicate that it moves upward.
SL , TP mention in chart.

MKR/USDT: Accelerated Golden Cross & Strong Uptrend ConfirmationMKR is showing clear bullish momentum, forming higher lows and seeing increasing trading volume, both signs of a sustained uptrend. The price has reclaimed key moving averages and is now testing the 200 SMA ($1,517)—a critical level that, once broken, could trigger a strong upward move. Initially, the golden cross (50 SMA crossing above 200 SMA) was expected within 2-4 weeks, but given BTC’s renewed strength and rising market liquidity, this formation could now happen much sooner—potentially within 7-14 days if the current momentum continues.
With BTC stabilizing and likely resuming its uptrend toward $95K-$100K+, liquidity is expected to flow into strong altcoins like MKR. If MKR breaks and holds above $1,517, initial targets of $1,8 and $2,1 could be reached quickly. However, with higher volume and strong technical confirmation, a move toward $2,4 - $2,8 is highly probable. If momentum accelerates further, $3,0+ could be a mid-term target, supported by both technical and macro market conditions.
For traders, a confirmed breakout above $1,517 with strong volume would signal a breakout opportunity, while investors looking for accumulation zones might watch for pullbacks to $1,493 (100 SMA) or $1,223 (50 SMA) as potential re-entry points. With increasing volume, higher lows, and a likely golden cross arriving earlier than expected, MKR is positioned for a significant rally in the coming weeks.

Bullish Sentiment on MKRUSDTMy bullish buy setup on MKRUSDT is done utilizing the Structure & Liquidity a.k.a Quasimodo(QM) strategy.
Confluences are-
1) Market Structure
2) Order-Block
3) Liquidity
Targeting a 1:2.5RR minimum.
Note: trading is all about probabilities which also makes my analysis a probability.
PS: I drop cryptocurrency market analysis here now while i drop forex(currency) market analysis on my second TV account with username @Meekbosslife-QM

Analysis of MKR/USDT Chart
**Analysis of MKR/USDT Chart**
Based on the analysis of the MKR/USDT (Maker/Tether) chart, it appears that the cryptocurrency is in a downtrend. Each time the price hits the resistance line (downtrend line), it experiences a drop of approximately 24%.
### **Detailed Analysis:**
1. **Number of Hits to Resistance:** The price has hit the downtrend resistance line three times at points marked with white circles.
2. **Percentage Drop:** Each time the price hits the resistance, it experiences an average drop of 24.07%.
3. **Time of Drop:** Each drop occurs over a period of 16 days (16 daily candles).
### **Conclusion:**
This pattern suggests that every time MKR hits the resistance line, it follows with a decline of approximately 24% in price. This information can be used as a technical signal to identify potential buying and selling opportunities.
### **Key Points:**
- **Strong Resistance:** The downtrend line acts as a strong resistance level.
- **Using the Signal:** If this pattern continues, it can be utilized as a trading signal.
- **Risk Management:** Always employ risk management techniques to mitigate potential losses.

short MKR We got wekness and CVD
going to about 1510 to upper VWAP of last wave
or may be together with TOTAL lower low .

Maker: Elliott Waves Theory ($6,111 & $9,407)I think what is most beautiful about this method is its simplicity.
Let's review Maker in terms of Elliott Waves.
We have two main patterns.
The impulse and the correction.
An impulse develops mainly in five waves. (1,2,3,4,5)
The correction in three waves. (ABC)
An impulse will lead to a correction.
A correction will lead to an impulse.
To use this system, we just need to spot where the market is at in the present time.
There was a clear bullish impulse between 2023 and 2024.
This impulse was followed by a correction.
The current correction can be over or might not be over.
For example, the C wave 3-Feb. can continue lower and bottom at a later date. This can only be known after the event.
What we know for sure is that MKRUSDT is now within a correction and after this correction a new bullish impulse will develop. An impulse produces a minimum of five waves.
We can expect rising prices based on this simple method.
We have targets between $6,111 (wave 3) and $9,407 (wave 5).
Thank you for reading.
Namaste.


MKRThe arrows marked on the chart are the appropriate areas to enter a short trade. Provided that the candlestick confirmation is formed.
The profit margins are marked on the image

long mkr main trend are still active and doesnt touch main POC
we got some 1 minutes approving ,and probably that we back to last week High and even more
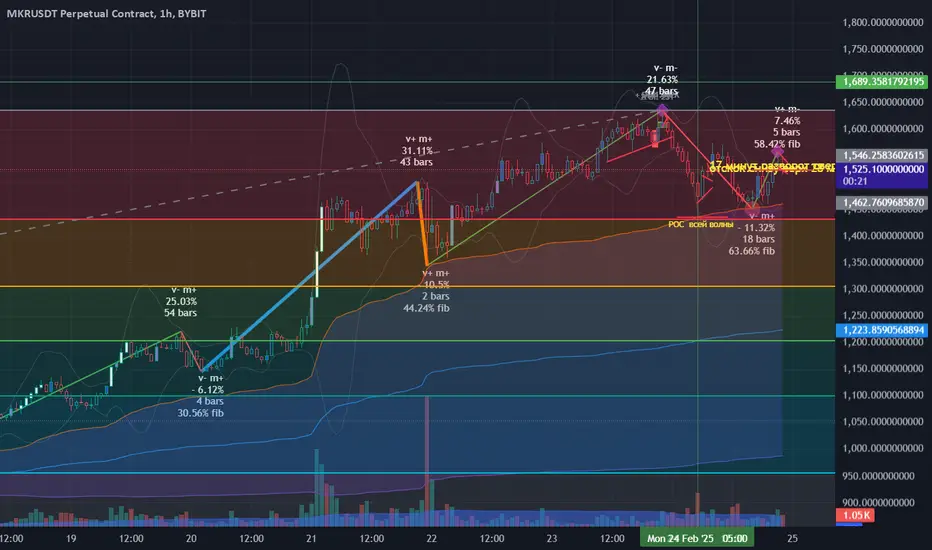
MKR - Long at last weeks point of control Bidding the untested point of control from last week.
Looking for a level to level play: Point of control to nearest area of supply.

