MKRUST trade ideas

MKR Short PositionMACD shows a bearish divergence. Expecting to form double Top pattern.
Waiting to make a higher high and hit S&D before entering this trade. :)).
practice lang tohwwww.

Trade #8 MKRMy Setups on MKR
Entry 754.4
TP Max 778.7 You can tp anywhere if cross TP 50%
TP 50% 761.9
SL 747.1 You can chose to comfort always DYOR


MKR LONG IDEA 4hrMKR in a bullish C and H formation, looking for an ENTRY on break of this resistance and confirmation of support.

MKR possible short tradeIn 4h chart we are in an important resistance if someone wants to open a short position it would be in this zone and the stop between 790/815$ isn't an investment recommendation

MKR / USDT Short...MKR/USDT Sell... This is not signal... Dont risk more than 3% of your account on any trade... LV 5!

MKR: TRADING IDEAMKR: TRADING IDEA
Seems to have a stable volume also in times of breakdown what can bring MKR to at last 14% increase.

MKR Maker Price PredictionGrayscale expressed concerns over the potential impact on the Ethereum Merge, especially on tokens that run natively on Ethereum:
The Merge may lead to a fork that might have unexpected and unfavorable outcomes and a scenario where stablecoins and tokens locked in smart contracts might not be redeemable.
Token and stablecoin holders might panic and start liquidating their holdings.
In this context, price target for MKR Maker is $660.
Looking forward to read your opinion about it.

MKR about to broke bearish channelAfter checked in a couple of timeframes and verified liquidity, seems that MKR is about to broke his strong support just to make a bulltrap and change his trend. Also don't forget to calculate your entry in PULLBACK after confirm trend change

MKR USDTwarning ! dai may will be depeged so be careful !
Naturally I expect that buyers gonna apear at support level !

Makerdao could make some decent uptrendIf Makerdao holds the 700$ mark, and break above 1k. I see a decent uptrent next upcoming months.

AAVE, COMP, MKR, UNI, CRV vs ETHThe chart shows the AAVE, COMP, MKR, UNI, CRV price performance vs ETH using the Binance USDT pair data.


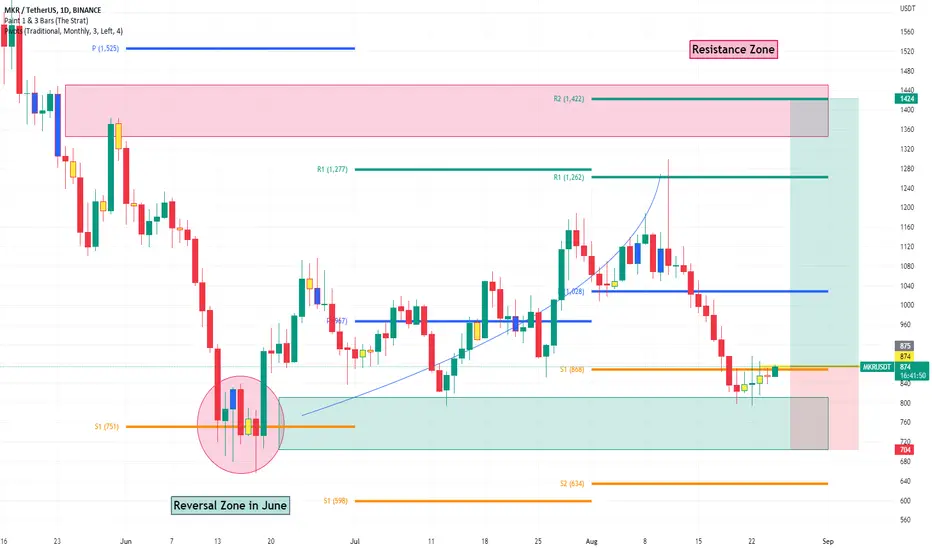
#MKR reversal idea #cryptoHello dear Traders,
Here is my idea for #Maker
Price finds support at monthly pivot S1 line – we had the same scenario at the June S1 pivot line.
Daily inside bar has been formed and we will wait for a close above the yellow trigger line (875$) in the 4h chart to enter the trade.
Profit target 1422$ and stop 700$.
Risk Reward ratio 3.2
Please feel free to ask any question in comments. I will try to answer all! Thank you.
About #Maker
Rank 55 by marked cap
Maker (MKR) is the governance token of the MakerDAO and Maker Protocol — respectively a decentralized organization and a software platform, both based on the Ethereum blockchain — that allows users to issue and manage the DAI stablecoin.
Initially conceived in 2015 and fully launched in December 2017, Maker is a project whose task is to operate DAI, a community-managed decentralized cryptocurrency with a stable value soft-pegged to the US dollar.
MKR tokens act as a kind of voting share for the organization that manages DAI; while they do not pay dividends to their holders, they do give the holders voting rights over the development of Maker Protocol and are expected to appreciate in value in accordance with the success of DAI itself.
The Maker ecosystem is one of the earliest projects on the decentralized finance (DeFi) scene: the industry that seeks to build decentralized financial products on top of smart-contract-enabled blockchains, such as Ethereum.
Source: Maker price today, MKR to USD live, marketcap and chart | CoinMarketCap
About Pivot Lines
The term monthly indicates that the pivot levels are calculated using the prior month’s high, low and closing price. The basic formulas are now well-known and pivot calculators are readily available on Tradingview.
If a market closes above the monthly pivot, then the trend is positive, and closing below the pivot is negative. In a positive market, you look for prices to pause, or maybe even reverse, at the first pivot resistance level (R1). If that level is exceeded, then the R2 is the next level to watch. Conversely, when a market drops below the monthly pivot, then the first downside target is the first pivot support (S1), and the second support is S2.
Source: Learn How To Use Monthly Pivot Analysis (forbes.com)
MKRUSD ❕ upward channelMKR is moving in a range within the upward channel.
The price has already made a false breakout of the lower boundary of the channel and is now trying to fix above it.
I expect that the price may continue to move within the uptrend channel after the final fixing. Further upward movement will depend on the price reaction to the nearest resistance level.


MKR/USDTMKR/USDT
Reverse head and shoulders!
Breaking the roof of the channel upwards!!
Interesting charts for me.
If the resistance of $1150 is broken, the price can increase up to $1500.
Let's not forget that Maker is one of the largest Dao and lender currencies.
#MKR #MKRUSDT #BTC #BTCUSD #LUNA #LUNC #UST

Maker MKR short Entry Range, Take Profit and Stop LossMKR/USDT short
Entry Range: $1000 - 1120
Price Target 1: $930
Price Target 2: $875
Price Target 3: $770
Stop Loss: $1210

Harmonic PatternsHarmonic Patterns
we have so many kinds of “Harmonic Pattern”:
Black Swan
Bat
Crab
Butterfly
Gartly
White Swan
Shark
Zero_Five
Cypher
Double Top
Double Bottom
📚👌🏻 Each one of them has its unique Fibonacci levels.
⚡️ Do you want to know them?
😍 Happy to see what you find in the charts, please share yours with us

MKR Should Continue Its Downtrend - Cryptoz18❶ Warning
Operations in the Blockchain or FX market represent a high risk. Cryptoz18 is a content creator who posts his ideas for viewers however he never provides an investment recommendation. I recommend to the reader a good risk management and knowledge regarding the environment. Thank you very much.
❷ Tutorials
➤ Here you can find a brief explanation of how the operations work in case you are interested in following them.
➤ Here you can find an explanation of how to track our ideas:
✔️ Our operations are taken with StopLoss and Take Profit of 15 minutes. However, we are looking to try and catch a 4H trend. So, once we touch the TPM according to your own analysis you should consider whether to close the trade or move StopLoss to entry.
❸ Summary
First I have to open my trades on Binance, if not then I don't have time. Sadly it took me a long time and a lot of the movement just happened, if it doesn't go back to that entry consider changing the setup settings.
❹ Operational Information
• Entry price: 1056.5
• StopLoss: 1084.4 (Loss 3.23%)
• TakeProfit Minimum: 1020.2 (Win 3.23%)
• Recommended margin: 5% of the Futures account
• Recommended leverage: 1x.
• Temporality: 15Min - 4H

MakerDAO ,(MKR/USDT analysis) 📈📉Hello Crypto community Welcome to this introduction for another high potential crypto project.🚀💰
🔹Rank #50,/ kind : Token \\ max Supply: 1,005,577/// Circulating Supply:977,631.04 MKR ( 97 %) ====> Great✅✅
Market Cap:$1,041,472,168\\ Fully Diluted Market Cap : $1,041,472,168===> Great ✅
Total Value Locked ( TVL ) :$8,425,065,955\\\ Market Cap / TVL Ratio: 0.1238 ===> Great ✅✅
🔰What Is Maker (MKR)?
Maker (MKR) is the governance token of the MakerDAO and Maker Protocol — respectively a decentralized organization and a software platform, both based on the Ethereum blockchain — that allows users to issue and manage the DAI stablecoin.
Coinarketcap-makerdao.com
-------------------------------------------------------------------------------------------------------------------
📊Technical
As you can see on the WEEKLY timeframe for MKR/USDT ,since May 2021 that MKR recorded an ATH about $6348 , it has been declining in a downward channel and has lost more than 83% of it worth untill now ,and It's already trading on the pivot zone , also recently revealed both positive and hidden negative divergences in current candle ,thus if want to rise more ,it should be able to maintain itself above the current pivot zone , to be able to reach higher R zone or after breakout the upper trendline , may even see the anchored VWAP ( black line) .
but otherwise if weekly candle closes below the current P zone it may fall again on the lower DEMAND zone to be more accumulated there to have a possible jump again .
✌️ Good luck with your trading and investing and remember: Trade smart…OR JUST DON’T TRADE!
--------------------------------------------------------------------------------------------------------------------
👉This analysis is my personal opinion ,not a financial advice ,so do your own research.
💚 if you're fan of my analyses please follow me , give a big thumbs 👍 OR drop a comment 🗯

