Up to date...This is going as expectedMAna follows a clear EW impulsive pattern, be patient, and always be ready for unexpected movements in the predicted ranges.
When a bull has too many riders, it is sure it will make the extra load fall...
This is not financial advice.
MNAUSD trade ideas

The beautiyness of EW (Up to date)What a wonderful lesson of EW patterns are being deployed by Mana a great lesson to learn ;)
We keep the EW strategy/pattern we have shown in previous ideas. The time frame from this idea shall not be a reference to follow.
This is not financial advice.
" The big money is not in the buying and selling … but in the waiting.” Charlie Munger

Mana breaking out :)Mana looking good Stoch RSI just hit 50 and looks to be rising, lets see how it turns out :)

MANAUSD To 15.00 or moreMana rolls into 5.00 under the radar shows much more to come. Still sticking to 15-18 near term moving Momentum upwards. Rocking your Socks Off. Hits 1.5b on vol

Slowly but steadily, MANA is moving up ..Check out the rising fan lines. BINANCE:MANAUSD is moving up steadily. Good time for both fresh longs and accumulation.

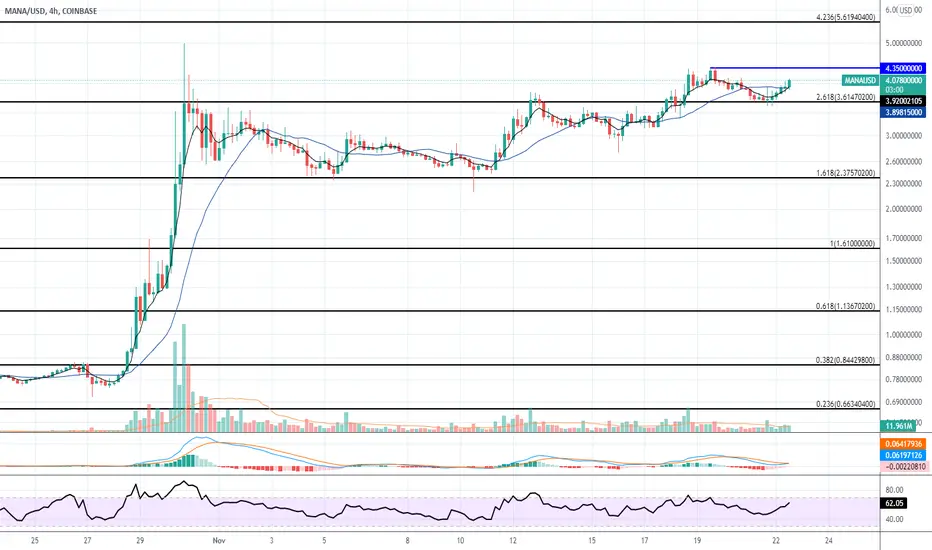
MANA Targets 4 Hour ChartWe are currently consolidation after an impressive macro run on volume.
Current short term sideways consolidation between $2.6 & $3.62.
Any break of the $3.62 will bring continuation around $5 @ 2.618 Fib
Invalidation under $2.2 on the 4HR
Invalidation under $2 on the Daily


Inverse head and shoulder as both reversal and continuation Hi earlier I published a head and shoulder as a continuation pattern for QNT. I found a viewer was confused and believed head and shoulder was solely a reversal pattern. Here is a good example head and shoulder acting both as a reversal and continuation pattern. On Mana's chart, we see there are 2 head and shoulder patterns. The first one you can consider as a reversal. The price starts to drop and it follows an inverse head and shoulder pattern. Price rallies after the inverse head and shoulder. The second inverse head and shoulder is a continuation pattern. The price continues to rally after the second inverse head and shoulder. It is stated in John Murphy's book, head and shoulder can both act as continuaion and reversal pattern. One most important thing to take home is regular head and shoulder is bearish while inverse head and shoulder is bullish, no matter it is acting as reversal or continuation pattern.

MANAUSD Rising Wedge This is the four hour chart for MANAUSD
A rising wedge can be seen to form above the recent burst of price
If this collapses as suggested by the rising wedge (a bearish pattern ),
0.786 is a good target because it provides a support which was previously a resistance point for the coin

Path to new ATH?I've wanted to write about all of the Cup and Handles that I've noticed on the micro (even when making very short term decisions on the 5min) trend during MANA's latest run. It makes sense, it is a bullish formation and MANA is very bullish. I've said in past posts that MANA is "behaving really well." From textbook H&S to Inverted H&S to all the C&Hs to respecting the ascending channel without fault, MANA has been pretty easy to speculate. It even follows rules with regard to time as a function.
IF YOU BELIEVE MANA CAN HIT UPWARDS OF $5, $9, $10+, there has to be a path and the current setup could be HOW WE GET THERE. What we are seeing now is the formation of a massive Cup and Handle on the macro chart, with what will bring all-time highs. It's target is massive and supported by the 1st leg up on the Fibonacci extension. I think/hope we are here. At the very least, I'm bullish on the short-term micro chart as a smaller C&H is forming, also confirmed by the short-term Fib. extension. This short-termT cup may be just the catalyst we need to break higher, and then onto the "big picture C&H."
All that being said, BE CAREFUL. One good reason to be skeptical is that I generally don't use data from the original pump when making a forecast. However, I've also missed out more than not when doing so. I'm a "chart guy" and this is just what the chart is saying, in how I'm reading it. Too good to be true? It should be, but this is not the Fortune 500 market. 45% spike isn't ever out of play and happens frequently. Look for a break above $4.38 and keep an eye on the micro 13% gains? This is definitely worth paying attention to. This is just an idea that I'm sharing with you...not financial advice. I'm looking forward to watching this play out. Keep in mind, this target may not happen in a day...we still have to break out of the triangle, AND pass the ATH...this little 13%+ cup will put us out of the triangle and just below the ATH. A lot of potential volatility and stomach aches ahead. Volatility = opportunity. Set stop losses, don't invest more than you can afford to lose, and good luck. Let me know if you are seeing something very different, please.

MANA TO THE MOON BITCH YOU GUESSED IT...messing around and putting a long trade in on MANA to reach SAND price by 12pm 11/24/21

Mana preparing for takeoff Mana is looking sweet on the 4hr frames can just see what's ahead and its shaping up to be a nice run up :)

$MANA Technical Analysis & Price PredictionIn this video we breakdown the textbook movement of MANA on the 4h chart.
MANA found resistance at $4.30 today and is heading down trying to find support.
I give you my prediction as to where MANA will find support and how much longer it can keep this amazing bull run going.

$MANA forming a cup and handle patternSeems like mana has formed a cup and handle pattern. This is a bullish indicator.
I can see the price exploding to 5.5 with big bullish news that might come out. If you know of any news please comment. Thanks

You didn't miss out......you never do. Sure, we've all missed a sell or buy that can make you sick to your stomach. But as we learned within a couple of hours or days, it always goes back. Remarkably, more like dumb luck, my last post contained orange dashes to show potential movement. It followed it to a tee. I'm not patting myself on the back, in fact, I'm going to erase them because it's dangerous to think that is even practical. I'm not sure when, because MANA just found huge support at $4.08, but there is a strong case to be made for the price coming back to the $3.88 area. There's a great case for it to also visit $3.55. The "M" shape would happen to play out exactly with the short-term .5fib around $3.88. I chickened out earlier, sold at a nice round $4.20 even though my plan was $4.24. With the bullish momentum increasing, I will happily settle for getting back in at $3.88. $3.55 would be cool, but I'm also happy MANA didn't blast through $4.25 and keep flying higher. Volume is picking up and it is getting super volatile. Even though I erased the dumb dashes from the last post, the pink circles are logical spots for one last touch of the lower trend line before blasting out of the triangle pattern. Should we breach the upper trend line in a meaningful way, then we will not be hitting the pink circles.
Be very careful. Although there are no indications of a major dump, the volatility is screaming and it could just as well crash down to the $3.30 level should support not be made. MANA could also just go off like a rocket. If you miss out, don't sweat it, just do your research and enter a new position. Check out ATR's and how to use them when setting Stop Losses. If you're new to this, make sure you are on a reasonable time frame when checking the ATR. Again, be very careful right now. A lot of things are coming to a head the next couple days. Keep your fingers crossed because it's completely out of our hands. MANA has a mind of its own.

MANAUSD (4H) Bullish wave We2Hi Traders
MANAUSD (4H Timeframe)
A Med-High probability, entry signal to go LONG will be given with the upward break of 4.05 after the market found support at 3.52. Only the downward break of 3.52 would cancel the bullish scenario.
Trade details
Entry: 4.05
Stop loss: 3.52
Take profit 1: 4.88
Take profit 2: 5.72
Score: 6
Strategy: Bullish wave We2

MANA continues to "defi" the overall short term crypto trend......see what I did there?
I'm going to quit while I'm ahead with the crystal ball from a couple of days ago. I was 1/2 joking when I put the red? where I thought we'd find that support because we can have a good idea of supports and resistances, but "when" that happens is, in my case too, luck. I do think it is going to want to bounce off of the lower support line at some point, and that may have to be when it climbs into range, above yesterday's low, probably in the low $3.60 area. MACD, Volume Oscillator, RSI are all looking bullish.
Today's chart has Thick Green from the other day and is our skeleton. The Short-term for the next couple of days is in purple, thicker lines are stronger than thin, and the dashed blue/orange lines are just the type of path (not close to exact) I think MANA will follow as it finds support, meets resistance, gets rejected, etc...until a breakout happens. This is all invalidated should we slip below $3.30. The pink circles are just places above yesterday's support where I think MANA will have to hit to make the big push up. Do your own research because this is not financial advice. Be safe and set your SL's.

MANA has a couple obstaclesHere we see price resting on the gann as support (hopefully) and once it continues it's rise we need to break the yellow line (long term trend from all time high) in order to continue to the top of the channel (green line) hopefully we see it materialize sometime soon. If we break the green line we might see a rise to all time highs or at least hit the gann line above it.

MANAUSDT Long Looking Great Right NowA MANAUSDT Long position is looking good here with a mixture of TA and Indicator signals like a long on my VWAPRSI and momentum (based on the TTM Squeeze) looking to go positive.

MANA Decentraland EMA 200 mix MULTI XMANA Decentraland EMA 200 Mixed MULTI X
Decentraland is an Ethereum-based blockchain platform where users can purchase, build and monetize virtual reality applications. Users can purchase virtual land in the platform’s world which gives them ownership and control over the environment and applications they create within their land. Decentraland is a virtual reality platform powered by the Ethereum blockchain that utilizes two tokens. MANA is an ERC-20 token that serves multiple purposes, where it is mainly burned in order to claim LAND (an ERC-721 token) as well as to make in-world purchases of goods and services4. Decentraland is divided into a total of 90,000 parcels of LAND, each measuring 16 x 16 “meters.”
MANA can be stored in ERC-20 compatible wallets.

MANA - Trend Following Buy Setup!Hello everyone, if you like the idea, do not forget to support with a like and follow.
MANA is overall bullish trading inside the blue channel and now approaching the lower bound / blue trendline so we will be looking for trend-following buy setups on lower timeframes.
on M30: MANA is forming a trendline (in red) but it is not valid yet, so we are waiting for a new swing high to form around it to consider it our trigger swing. (projection in purple)
Trigger => Waiting for that swing to form and then buy after a momentum candle close above it (gray zone)
Meanwhile, until the buy is activated, MANA would be overall bearish can still trade lower.
Good luck!
All Strategies Are Good; If Managed Properly!
~Rich

$MANA with the bullish continuation$MANA is bouncing perfectly from the horizontal resistance turned support, which also coincides with the support of the bullish trend line.
This is a good risk/reward of over 3, and I'm taking it with a conservative target of the previous highest close.
