Moodeng Set to Drop 33% with Target at 0.12500 SoonHello,✌
let’s dive into a full analysis of the upcoming price potential for Moodeng 🔍📈.
OKX:MOODENGUSDT is currently approaching the upper boundary of a strong descending channel, aligned with a significant daily resistance level. Given this setup, a correction of at least 33% appears likely,

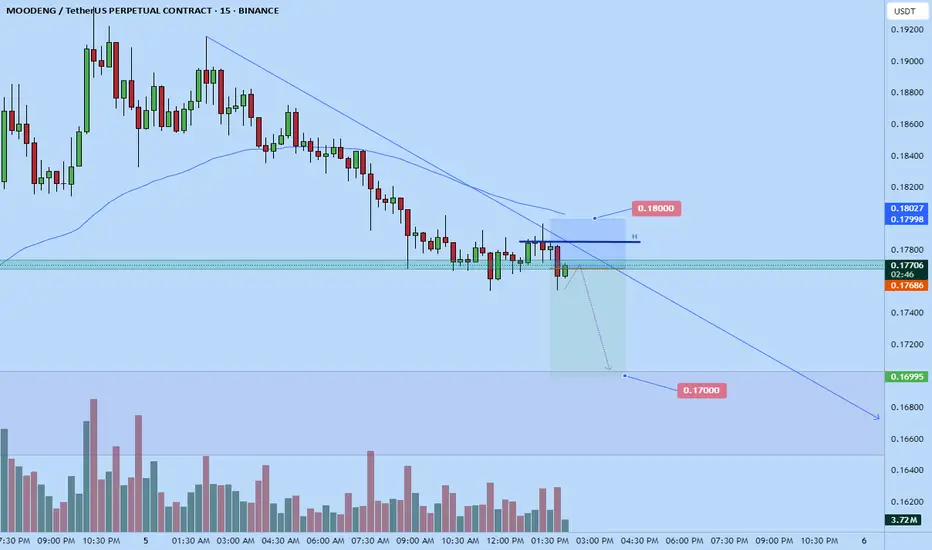
Moodeng short now!Hopped into a moodeng just now. Its about to fall based on my DTT analysis
Lets see how it goes
Stop: $0.18 or higher
Tp: $0.17 area
Time sensitive
MooDENG price analysis😭 How “fun” you can live trading memecoins!)
First, -97% dump, and then +1600% if from the absolute bottom, or +800% of a rapid pumping)
And with all this, the capitalization of #MOODENG is only $275 million, and at the maximum it was around $600 million.
🕯 Moreover, on the OKX:MOODENGUSDT chart

Breakout Alert: $MOODENG Looks Ready to Pop!$MOODENG looks ready to break out! 🚀
The chart is showing a falling wedge pattern, which is usually a sign that the price may go up soon.
Price is holding strong at support, and if it breaks above $0.193, we could see a move toward $0.222 or even higher (that’s around a 32% gain).
Trade Idea:
🔹 Bu

MOODENG/USDTKey Level Zone: 0.16800 - 0.17700
LMT v2.0 detected.
The setup looks promising—price previously trended upward with rising volume and momentum, then retested this zone cleanly. This presents an excellent reward-to-risk opportunity if momentum continues to align.
Introducing LMT (Levels & Momentum

Phemex Analysis #94: Pro Tips for Trading MooDeng (MOODENG)MooDeng ( PHEMEX:MOODENGUSDT.P ) is a playful, Solana-based meme coin inspired by a charming pygmy hippopotamus born at Thailand’s Khao Kheow Zoo. Since its debut in 2024, MOODENG has quickly captured crypto enthusiasts' imaginations, gaining prominence through explosive price surges and a rapidly

moodeng buy setup scalp & swingIf btc stays sideways till fri-sat it can hit swing tp, also during eid days I won't recommend you to take any trade due to dry volume, less volatility. It's a meme token so use tight sl and don't use high margin on this trade. Good Luck.

MOODENG – Wave 2 In Play, More Upside Ahead
Might be a bit bold here, but I see OKX:MOODENGUSDT pushing higher as long as it holds the 13c level.
It had a strong impulsive move, and this looks like wave 2 of the current momentum.
Daily downtrend signals from the local high have already expired, increasing the odds of continuation from h

Moodeng short to $0.14726Hopped into a moodeng short a while ago. Targetting $0.14726 for a 2 RR roughly.
Time sensitive. This is a corrective short in an uptrend. Price is quite high.

On the way 10% upn21% up with in 4 hours if some follow me and take my entire ftom my previous post take some profit SL entry 🚀🚀📈

See all ideas
Summarizing what the indicators are suggesting.
Oscillators
Neutral
SellBuy
Strong sellStrong buy
Strong sellSellNeutralBuyStrong buy
Oscillators
Neutral
SellBuy
Strong sellStrong buy
Strong sellSellNeutralBuyStrong buy
Summary
Neutral
SellBuy
Strong sellStrong buy
Strong sellSellNeutralBuyStrong buy
Summary
Neutral
SellBuy
Strong sellStrong buy
Strong sellSellNeutralBuyStrong buy
Summary
Neutral
SellBuy
Strong sellStrong buy
Strong sellSellNeutralBuyStrong buy
Moving Averages
Neutral
SellBuy
Strong sellStrong buy
Strong sellSellNeutralBuyStrong buy
Moving Averages
Neutral
SellBuy
Strong sellStrong buy
Strong sellSellNeutralBuyStrong buy
Displays a symbol's price movements over previous years to identify recurring trends.