MOVEUSDT trade ideas
MOVE - Movement, will it be so? 📊 MOVE/USDT Technical Analysis 🔍
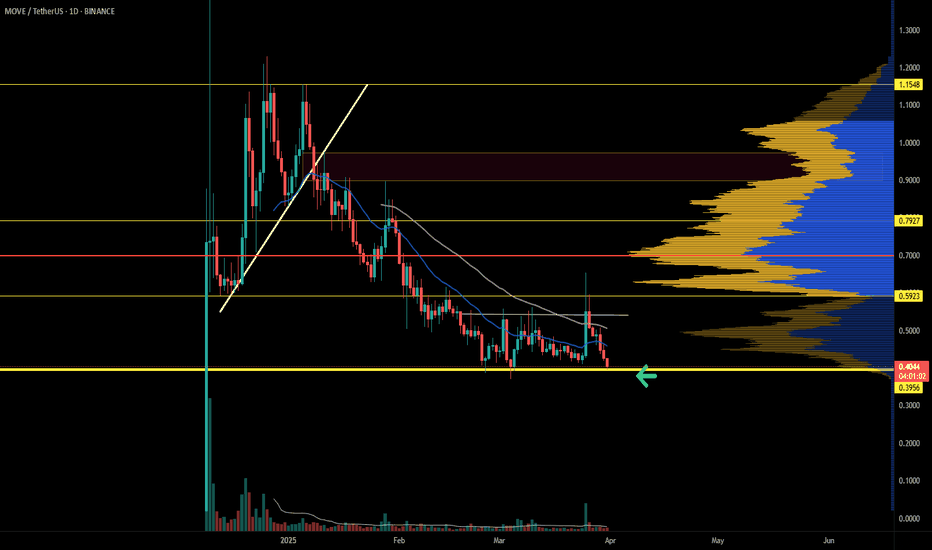
The chart indicates that the asset is in a consolidation phase after a strong downtrend. Currently, the price is approaching a key resistance level, defined by the descending trendline. Let’s analyze the key points to watch:
🔹 Support and Resistance Levels (Possible stage 1 to break!)
Key Resistance: $0.60 - $0.65 (highlighted blue zone) → A breakout above this level could trigger a strong bullish move.
Major Support: $0.40 - $0.42 (highlighted blue zone) → A drop below this zone could invalidate the bullish structure.
📈 Technical Indicators
EMA 4 (black line) and longer EMA (green line) → The price is currently testing these levels, which could act as dynamic resistance.
RSI (Relative Strength Index) → Sitting near 50, indicating a neutral momentum. A move above 55-60 could confirm bullish strength.
📉 Trend Outlook
MOVE/USDT has been in a prolonged downtrend, with the descending trendline acting as a strong resistance.
If the price breaks above the $0.60 - $0.65 level, the next target zones are:
$0.80 - $0.85 (Intermediate target)
$1.20 - $1.30 (Major resistance zone from previous highs)
However, if the price gets rejected at the trendline and loses support at $0.42, we could see another bearish leg down.
🎯 Conclusion
The next move depends on whether MOVE/USDT can break above the descending resistance and the key $0.60 level. Watch for increasing volume and RSI confirmation to validate a potential breakout.
Move short to $0.1575Entered #move short just now
Might get some drawdown, entry is a bit aggressive but the stoploss of $0.1773 might be enough as the supply dump from earlier was quite aggressive so there's a good chance the market will react similar again.
Plus heard they had an airdrop today which might have been the reason for the aggressive supply dump
$MOVE Setup Looks Clean – Support Holding Strong!!TVC:MOVE busted out of the downtrend and is currently testing the resistance trendline as a support line✅
Price is remaining at the level of the 0.236 Fib and resting on a pivotal area the retest has the potential to prepare the ground for the next leg up to $0.24+.
DYOR, NFA
WOWDue to another delay in airdrops and feedback from the community, it seems all these reviews have led to coinbase planning to delist. Within 2 minutes! It dropped about 20%. This is a sale of approximately $1.3 million worth of tokens.
This is the definition of rug pulling compliments of your local Centralised exchange.
It is looking like the end for Movement Labz, unless the network can provide some much needed utility and a miracle.
Market sentiment moves markets, and yours is not great!
Target... $1 000 000 000! LMAO 🤣
Will be happy with £1 or any green going forward.
@Dyl_uk
MOVE hughe FW breakout incomming?MOVE has been dropping over 80% from it's ATH.
This looks like bearmarket scenario's. But as I did mention before in other posts. This bull cycle is different and especially for ALTCOINS. The massive growth in number of ALTS makes it hard to stand out and gain momentum. The money and social attention is widely spread over milions of coins now. The 1875 active accounts holding MOVE is reasonable for a relative new project jet it doesn't signal mass adoption.
MOVE is a Layer1 / 2 and ZK coin in the smart contracts. It's also in the World Liberty Financial portfoilio and made in the USA. These fundamentals are bullisch for MOVE. A breakout from the FW pattern could make it take off at rocket pace towards the former highs.
Allong the way we can see and identify several major S/R line that have to be broken first.
Indicators:
The rounded bottom / consolidation could mark the bottom.
Stoch indicator: The STOCH shows signs of recovery
Golden Cross: The short term MA has been crossing the Long term MA signaling recovery.
Volume: The low volume is typical for the consolidation.
CONSOLIDATION above support and below resistance
The level where we find MOVE right now looks like consolidation and bottom possibility. With support at 0,218 a small resistance at 0,34 and a major resistance at 0,56.
My trading plan for now:
I will open a new bigger SPOT position in order to lower my AVG ENTRY that has lost over 60% in the last months. A run up from this level to the S/R level 0,56 means a 177% profit.
Due for reversal!Showing support on the Fib. Multiple trend lines forming a giant arrow. Not sure this what this pattern is called. Points to a pivot point maybe. Now it's up to the team to build and be serious. Utility.
Discount zone on the Daily and 4hr. Bottoms in?
NFA. DYOR.
Entry Now!
TP rationale!
@Dyl_uk
Breaking: Movement Token ($MOVE) Dips 12% TodayThe price of Movement coin ( TVC:MOVE ) nosedived 12% today, leading to a bearish pennant.
The ecosystem of Modular Move-Based Blockchains that enables developers to build secure, performant, and interoperable blockchain applications, bridging the gap between Move and EVM ecosystems has experience immense selling pressure today albeit the general crypto industry was also in a state of turmoil with CRYPTOCAP:BTC losing its $85k grip now down to $83k.
The first Move-EVM L2 for Ethereum has not being exempted, as hinted by the RSI at 20.64, TVC:MOVE has long being oversold with the asset moving around the 1-month low axis and a break below that axis could be dire for TVC:MOVE token.
Similarly, a break above the 50% Fibonacci retracement point could resort to a bullish reversal for Movement token ( TVC:MOVE ).
Movement Price Data
The Movement price today is $0.251764 USD with a 24-hour trading volume of $104,973,849 USD. Movement is down 10.27% in the last 24 hours. The current CoinMarketCap ranking is #87, with a live market cap of $616,822,310 USD. It has a circulating supply of 2,450,000,000 TVC:MOVE coins and a max. supply of 10,000,000,000 MOVE coins.
MOVE at a Critical Level – Breakout or Rejection?🔥 MOVE 1D Chart Update!
📉 Price is retesting the upper boundary of the falling wedge as support—a key zone for potential continuation.
⚡ If this level holds, it could signal bullish strength and a push higher!
👀 Will buyers step in, or is a deeper pullback on the way? Stay sharp! 🚀
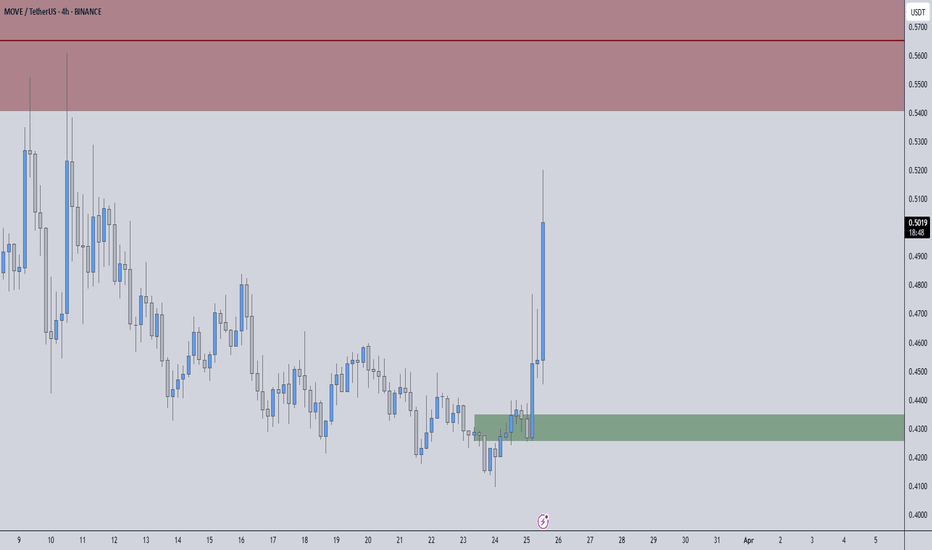
MOVEUSDT – High-Probability Setup, Stay Sharp📌 Key Levels Mapped Out – Now It’s About Execution.
🟢 Green Box = Strong Support – Buyers are showing interest, but confirmation is key.
🔴 Red Box = Major Resistance – A reaction here could lead to a solid rejection.
How We Approach This:
Support Holds? → We wait. LTF breakouts + CDV confirmation = high-confidence long. No guessing, just data.
Resistance Rejected? → No blind shorts. LTF shift bearish + CDV confirmation = strong setup.
Breakout? → We don’t chase. Retest + volume confirmation = real trade opportunity.
Most traders get caught in emotions—we don’t. We move with structure, volume, and confirmation.
Stay disciplined, execute the plan, and let the market do the work.
✅I keep my charts clean and simple because I believe clarity leads to better decisions.
✅My approach is built on years of experience and a solid track record. I don’t claim to know it all but I’m confident in my ability to spot high-probability setups.
✅If you would like to learn how to use the heatmap, cumulative volume delta and volume footprint techniques that I use below to determine very accurate demand regions, you can send me a private message. I help anyone who wants it completely free of charge.
🔑I have a long list of my proven technique below:
🎯 ZENUSDT.P: Patience & Profitability | %230 Reaction from the Sniper Entry
🐶 DOGEUSDT.P: Next Move
🎨 RENDERUSDT.P: Opportunity of the Month
💎 ETHUSDT.P: Where to Retrace
🟢 BNBUSDT.P: Potential Surge
📊 BTC Dominance: Reaction Zone
🌊 WAVESUSDT.P: Demand Zone Potential
🟣 UNIUSDT.P: Long-Term Trade
🔵 XRPUSDT.P: Entry Zones
🔗 LINKUSDT.P: Follow The River
📈 BTCUSDT.P: Two Key Demand Zones
🟩 POLUSDT: Bullish Momentum
🌟 PENDLEUSDT.P: Where Opportunity Meets Precision
🔥 BTCUSDT.P: Liquidation of Highly Leveraged Longs
🌊 SOLUSDT.P: SOL's Dip - Your Opportunity
🐸 1000PEPEUSDT.P: Prime Bounce Zone Unlocked
🚀 ETHUSDT.P: Set to Explode - Don't Miss This Game Changer
🤖 IQUSDT: Smart Plan
⚡️ PONDUSDT: A Trade Not Taken Is Better Than a Losing One
💼 STMXUSDT: 2 Buying Areas
🐢 TURBOUSDT: Buy Zones and Buyer Presence
🌍 ICPUSDT.P: Massive Upside Potential | Check the Trade Update For Seeing Results
🟠 IDEXUSDT: Spot Buy Area | %26 Profit if You Trade with MSB
📌 USUALUSDT: Buyers Are Active + %70 Profit in Total
🌟 FORTHUSDT: Sniper Entry +%26 Reaction
🐳 QKCUSDT: Sniper Entry +%57 Reaction
📊 BTC.D: Retest of Key Area Highly Likely
📊 XNOUSDT %80 Reaction with a Simple Blue Box!
I stopped adding to the list because it's kinda tiring to add 5-10 charts in every move but you can check my profile and see that it goes on..


