move +target 1.82 🤑
buy and wait to full target !
movment futures shine
buy and wait for this coin .
MOVEUSDT trade ideas

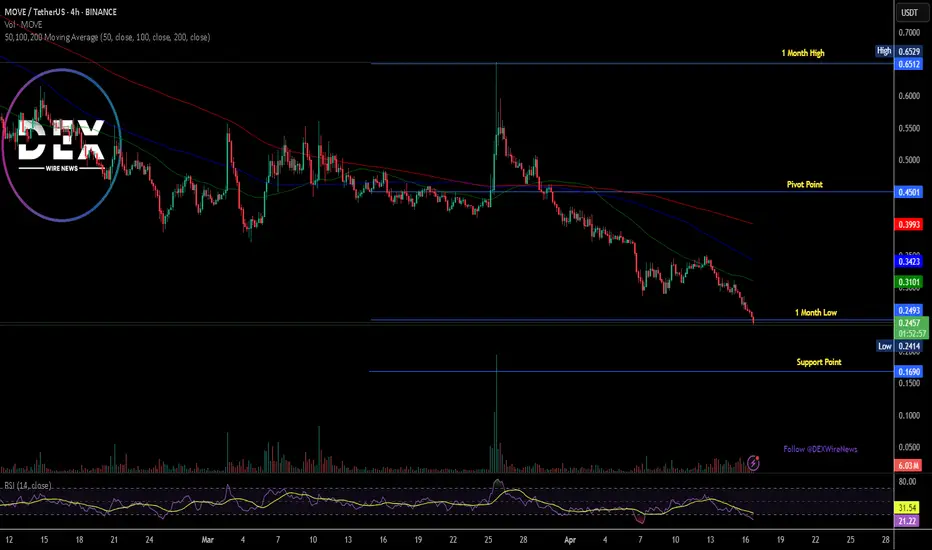
Breaking: Movement Token ($MOVE) Dips 12% TodayThe price of Movement coin ( TVC:MOVE ) nosedived 12% today, leading to a bearish pennant.
The ecosystem of Modular Move-Based Blockchains that enables developers to build secure, performant, and interoperable blockchain applications, bridging the gap between Move and EVM ecosystems has experience immense selling pressure today albeit the general crypto industry was also in a state of turmoil with CRYPTOCAP:BTC losing its $85k grip now down to $83k.
The first Move-EVM L2 for Ethereum has not being exempted, as hinted by the RSI at 20.64, TVC:MOVE has long being oversold with the asset moving around the 1-month low axis and a break below that axis could be dire for TVC:MOVE token.
Similarly, a break above the 50% Fibonacci retracement point could resort to a bullish reversal for Movement token ( TVC:MOVE ).
Movement Price Data
The Movement price today is $0.251764 USD with a 24-hour trading volume of $104,973,849 USD. Movement is down 10.27% in the last 24 hours. The current CoinMarketCap ranking is #87, with a live market cap of $616,822,310 USD. It has a circulating supply of 2,450,000,000 TVC:MOVE coins and a max. supply of 10,000,000,000 MOVE coins.
MOVE at a Critical Level – Breakout or Rejection?🔥 MOVE 1D Chart Update!
📉 Price is retesting the upper boundary of the falling wedge as support—a key zone for potential continuation.
⚡ If this level holds, it could signal bullish strength and a push higher!
👀 Will buyers step in, or is a deeper pullback on the way? Stay sharp! 🚀

MOVEUSDT – High-Probability Setup, Stay Sharp📌 Key Levels Mapped Out – Now It’s About Execution.
🟢 Green Box = Strong Support – Buyers are showing interest, but confirmation is key.
🔴 Red Box = Major Resistance – A reaction here could lead to a solid rejection.
How We Approach This:
Support Holds? → We wait. LTF breakouts + CDV confirmation = high-confidence long. No guessing, just data.
Resistance Rejected? → No blind shorts. LTF shift bearish + CDV confirmation = strong setup.
Breakout? → We don’t chase. Retest + volume confirmation = real trade opportunity.
Most traders get caught in emotions—we don’t. We move with structure, volume, and confirmation.
Stay disciplined, execute the plan, and let the market do the work.
✅I keep my charts clean and simple because I believe clarity leads to better decisions.
✅My approach is built on years of experience and a solid track record. I don’t claim to know it all but I’m confident in my ability to spot high-probability setups.
✅If you would like to learn how to use the heatmap, cumulative volume delta and volume footprint techniques that I use below to determine very accurate demand regions, you can send me a private message. I help anyone who wants it completely free of charge.
🔑I have a long list of my proven technique below:
🎯 ZENUSDT.P: Patience & Profitability | %230 Reaction from the Sniper Entry
🐶 DOGEUSDT.P: Next Move
🎨 RENDERUSDT.P: Opportunity of the Month
💎 ETHUSDT.P: Where to Retrace
🟢 BNBUSDT.P: Potential Surge
📊 BTC Dominance: Reaction Zone
🌊 WAVESUSDT.P: Demand Zone Potential
🟣 UNIUSDT.P: Long-Term Trade
🔵 XRPUSDT.P: Entry Zones
🔗 LINKUSDT.P: Follow The River
📈 BTCUSDT.P: Two Key Demand Zones
🟩 POLUSDT: Bullish Momentum
🌟 PENDLEUSDT.P: Where Opportunity Meets Precision
🔥 BTCUSDT.P: Liquidation of Highly Leveraged Longs
🌊 SOLUSDT.P: SOL's Dip - Your Opportunity
🐸 1000PEPEUSDT.P: Prime Bounce Zone Unlocked
🚀 ETHUSDT.P: Set to Explode - Don't Miss This Game Changer
🤖 IQUSDT: Smart Plan
⚡️ PONDUSDT: A Trade Not Taken Is Better Than a Losing One
💼 STMXUSDT: 2 Buying Areas
🐢 TURBOUSDT: Buy Zones and Buyer Presence
🌍 ICPUSDT.P: Massive Upside Potential | Check the Trade Update For Seeing Results
🟠 IDEXUSDT: Spot Buy Area | %26 Profit if You Trade with MSB
📌 USUALUSDT: Buyers Are Active + %70 Profit in Total
🌟 FORTHUSDT: Sniper Entry +%26 Reaction
🐳 QKCUSDT: Sniper Entry +%57 Reaction
📊 BTC.D: Retest of Key Area Highly Likely
📊 XNOUSDT %80 Reaction with a Simple Blue Box!
I stopped adding to the list because it's kinda tiring to add 5-10 charts in every move but you can check my profile and see that it goes on..

Movement [MOVE] is at horizontal support, will it bounce?MOVE is holding horizontal support. The most important aspect of this level is RR. These levels offer a great opportunity to be both offensive and defensive. this is what I call a trading moment.
Full TA: Link in the BIO

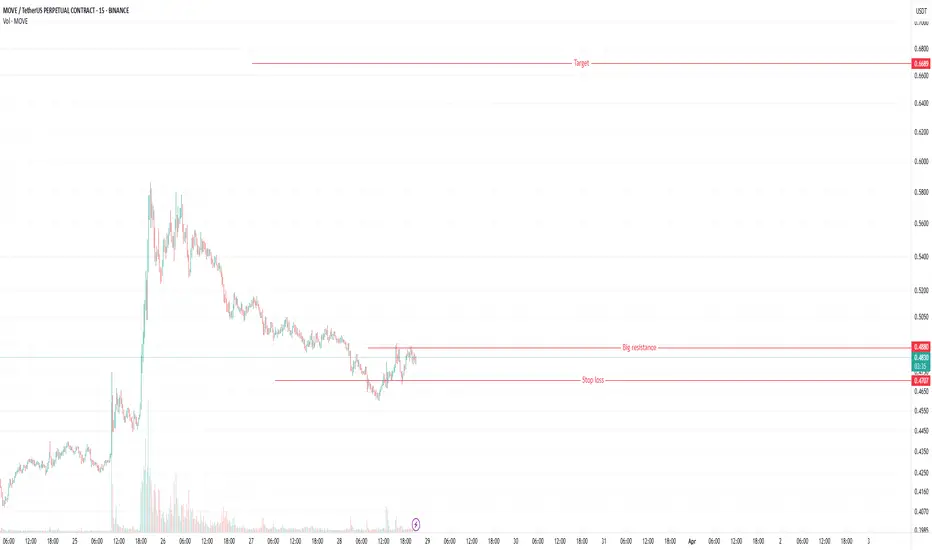
Move chartMove chart. Right now price is at resistance. We also have the stop loss level.
Intended target is at the red line from the top.
MOVEUSDT trade set-up!Join our community and start your crypto journey today for:
In-depth market analysis
Accurate trade setups
Early access to trending altcoins
Life-changing profit potential
MOVEUSDT is trading inside a descending triangle pattern!
Entering the below trade set-up in case of breakout!!
Entry: CMP to $0.4890
SL: $0.4778
Target: 10-15%
If you find this analysis helpful, please hit the like button to support my content! Share your thoughts in the comments and feel free to request any specific chart analysis you’d like to see.
Happy Trading!!

MOVEUSDT(Movement) Updated till 25-03-25MOVEUSDT(Movement) Daily timeframe range. fairly new PA here. as of that it got good opportunity for right setups. for now recent resistance at 0.6182 breaking that can push it toward 0.8622. local support at 0.4038.

$MOVE Surge 35% Today Amidst a Falling Wedge PatternMovement Network Native token ( TVC:MOVE ) saw its value rise sporadically gaining about
37% today albeit the general crypto landscape saw notable uptick with Solana reclaiming the $140 zone.
As of the time of writing, TVC:MOVE is up 38% trading within a bullish engulfing pattern after breaking past a falling trend channel. With the RSI at 66, this hint at a possible 200% surge in sight- a level that aligns with the token's ATH.
Movement Network is an ecosystem of Modular Move-Based Blockchains that enables developers to build secure, performant, and interoperable blockchain applications, bridging the gap between Move and EVM ecosystems.
Movement Price Live Data
The live Movement price today is $0.586188 USD with a 24-hour trading volume of $447,749,157 USD. Movement is up 35.13% in the last 24 hours, with a live market cap of $1,436,160,695 USD. It has a circulating supply of 2,450,000,000 MOVE coins and a max. supply of 10,000,000,000 MOVE coins.

Trading opportunity for MOVEUSDTBased on technical factors there is a Buy position in :
📊 MOVEUSDT
🔵 Buy Now or by Breakout
🪫Stop loss 0.3680
🔋Target 0.5500
📏 R/R 2
💸RISK : 1%
We hope it is profitable for you ❤️
Please support our activity with your likes👍 and comments📝

MOVEUSDT 12HMOVE ~ 12H Analysis
#MOVE This trade is very high risk. Buy gradually after successfully penetrating this resistant line with a short -term target of at least 10%+.

MOVE Price Analysis: Key Levels & Potential ScenariosCurrent Market Structure
Since mid-February, MOVE has been consolidating, with a critical support level forming around $0.4371.
This level aligns with a bullish daily gap and the midpoint of a previous candle tail, making it a key area to watch for a potential retest.
Following the mainnet launch, a "sell the news" reaction may test this support level before determining the next directional move.
Downside Risk: Key Support Levels
If $0.4371 support fails, there is minimal historical support below, making a drop more probable.
Possible profit-taking zones include:
$0.3705 (near bulls' stop levels)
$0.3500 (a major psychological support level)
Upside Potential: Resistance Levels to Watch
If MOVE rebounds off support and breaks above $0.4980 (previous rejection zone), the next bullish targets include:
$0.5573 (first major resistance level)
$0.5820 (historical rejection zone)
Conclusion & Strategy
Bullish Scenario: A strong bounce from $0.4371 could lead to a push toward $0.4980 and potentially $0.5573 if buying pressure sustains.
Bearish Scenario: A break below $0.4371 could accelerate losses toward $0.3705-$0.3500, where buyers may attempt to step in.
Key Watchpoint: How the price reacts at $0.4371 will dictate the next significant move. If it holds, bulls regain control; if it fails, further downside is likely.

MOVE UpdateThe Move project is looking good; it has potential for strong growth. Keep an eye on it, everyone!

Movement MOVE price analysisFor more than 3 months, #MOVE price has been steadily falling to the Buy Zone of $0.38-0.47 - did you buy it?
1️⃣ Well, now the first and foremost task is for #MOVEUSDT to confidently gain a foothold above $0.60
2️⃣ And then you can start dreaming about a rapid x3 growth to $1.80 per #Movement coin
Or is it too optimistic, don't you think?
_____________________
Did you like our analysis? Leave a comment, like, and follow to get more

MOVE/USDT Short Trade Update 📉 MOVE/USDT Short Trade Update 🚨
🔹 Entry: $0.477
🔹 Take Profit (TP): $0.4240
🔹 Stop Loss (SL): $0.4969
Currently in a short trade after price rejected from the upper trendline of the descending channel.
Key Points:
✅ Bearish structure intact, respecting the downtrend.
✅ MACD losing momentum, indicating potential downside.
✅ RSI rejected from overbought, signaling exhaustion.
📌 Next Steps:
🔸 Targeting $0.4240 as the next key level.
🔸 Will manage risk and adjust if needed.
Let’s see how it plays out! 🔥📊
#Crypto #Trading #MOVEUSDT #ShortTrade

MOVE is testing the blue support levelAnalysis 🚨
TVC:MOVE is testing the blue support level 🔵. If it breaks down, the next target will be the green line level 🟩.
🎯 Next Target: Green line level (if breakout occurs)

MOVEUSDT: Falling Wedge Pattern – 130%-140% Gains ExpectedMOVEUSDT is currently forming a Falling Wedge pattern, a bullish chart formation that signals the potential for a significant breakout. The Falling Wedge is a consolidation pattern where the price gradually narrows between converging trendlines, indicating that the market is coiling up for a possible explosive move. Although the breakout has not yet occurred, the setup is promising, and traders are anticipating a strong upward move once the price breaks through the upper trendline. With good volume supporting the formation, the breakout could lead to substantial gains in the range of 130% to 140%+.
The Falling Wedge pattern is a reliable indicator of an impending trend reversal, and the good volume accompanying this formation increases the likelihood of a successful breakout. When a price breaks above the resistance trendline, it often triggers a surge in buying activity, pushing the price higher. The growing investor interest in MOVEUSDT highlights that many traders are positioning themselves ahead of the anticipated move, ready to take advantage of the potential upside. With expectations of 130% to 140%+ gains, MOVEUSDT presents an exciting opportunity for those looking for high-reward setups in the market.
Investor confidence in MOVEUSDT is building as more participants notice the bullish potential of this setup. The volume accompanying the Falling Wedge formation suggests that there is enough market interest to drive the price higher once the breakout happens. If the price breaks above the upper trendline, it could see a sharp rally toward the projected gains, as further resistance levels are taken out. The current market sentiment, coupled with strong technical signals, positions MOVEUSDT as a strong candidate for an upward price movement.
Traders should stay alert and monitor the breakout point closely. Once MOVEUSDT clears the upper trendline with good volume, the move could trigger a chain reaction of buying, pushing the price toward the expected gain range. The combination of a well-formed technical pattern, solid volume, and increasing investor interest makes MOVEUSDT a crypto pair to watch closely for potential significant returns in the near future.
✅ Show your support by hitting the like button and
✅ Leaving a comment below!
Your feedback and engagement keep me inspired to share more insightful market analysis with you!

MOVE Crypto Market H1 (Wave Analysis)MOVE Crypto Market H1 (Wave Analysis)
As shown in chart.
Regards,

MOVEUSDT with compression in short termI think MOVE will be bearish in short term along with BTC 100-90k. There is Bull Div in 15 min. The price above 0.65 is a bit challenging for me.

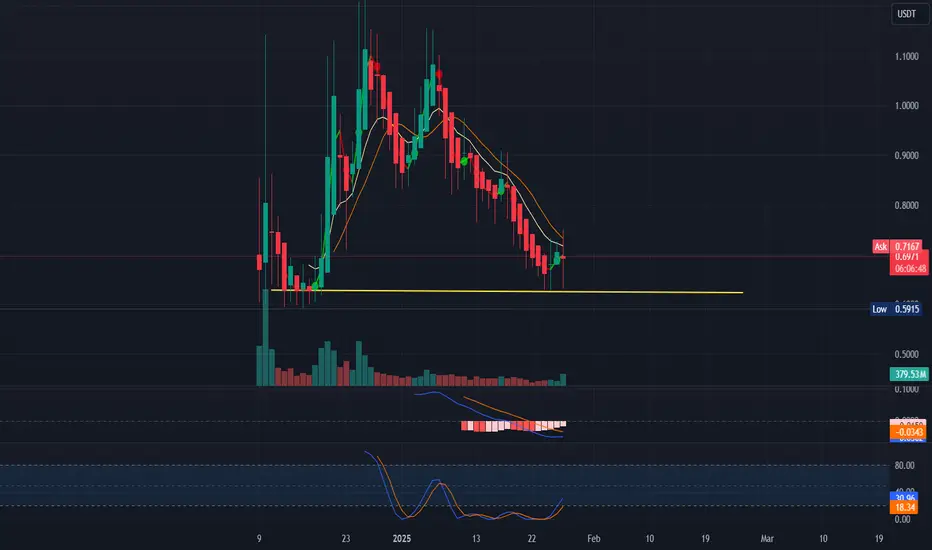
MOVE Jumps 12% as Trump-Linked World Liberty Financial Buys InLayer-2 token MOVE has surged 12% in the past 24 hours, making it the market’s top gainer. The rally follows news that World Liberty Financial, a Trump-backed DeFi platform, purchased $2 million worth of MOVE tokens on Tuesday.
Arkham Intelligence reports that the purchase was made in multiple batches, with the first transaction settling at 14:22 UTC. Just minutes later, at 14:48 UTC, a crypto account on X, DB, claimed that Movement is in discussions with Elon Musk’s Department of Government Efficiency (D.O.G.E). However, Movement’s co-founder Rushi Manche denied any official communication.
Despite the surge, bearish sentiment remains strong. MOVE’s funding rate has plummeted to -0.084%, its lowest since January 7, signaling increased short positions. Additionally, the token has seen consecutive spot outflows totaling $19 million, with another $440,470 exiting the market on Wednesday.
Profit-taking could erase MOVE’s gains, pushing it down to $0.71 or even $0.55 if support fails. Conversely, if demand surges, MOVE could break past $0.87 and head toward $1.08.
The question now: is this just a hype-driven pump, or can MOVE sustain its momentum?

MOVE/USDT (4H Chart)Trade Analysis & Setup: MOVE/USDT (4H Chart)
Key Observations:
Breakout from a Downtrend Channel 🚀
The price was in a descending channel, forming lower highs and lower lows.
A strong breakout above the channel and trendline resistance has occurred.
Volume spike supports the breakout, indicating strong buying pressure.
Support and Resistance Levels:
Support Zone: Around 0.67 - 0.70 USDT (previous resistance turned support).
Next Resistance: 0.88 - 0.93 USDT (marked as a potential target zone).
Retest & Confirmation
Price is likely to retest the breakout zone (~0.70 - 0.74 USDT) before continuation.
A successful retest with bullish confirmation would signal an entry opportunity.
Volume & RSI:
Volume Surge: Bullish confirmation of breakout.
RSI Rising: Approaching overbought but still has room for continuation.
Trade Setup:
📈 Long (Buy) Setup:
Entry: $0.72 - $0.75 (on retest of the breakout)
Stop Loss: Below $0.67 (to invalidate breakout)
Take Profit Targets:
TP1: $0.83 (previous resistance)
TP2: $0.90 - $0.93 (major resistance area)
📉 Bearish Scenario (Invalidation):
If price falls back into the channel and closes below $0.67, the breakout would be invalid.
Potential drop towards $0.59 - $0.63 if the retest fails.
Final Thoughts:
✅ Bullish breakout confirmed with strong volume and trendline break.
⏳ Waiting for retest around $0.72 - $0.74 for an optimal long entry.
🚨 Risk Management: Place stop-loss below $0.67 to avoid fakeouts.
Would you like me to format this into a social media-ready post with hashtags? 📢🚀

MOVE Confirmation to ride the breakout
#MOVE Price is testing the long zone, bouncing off key support for a potential bullish breakout
A move above resistance could fuel a strong rally toward major targets
🏹Target: $1.3237
🆘 ST : $0.476

MOVEmarket conditions are spicy and unstable, but if btc will jump 1k or more Move will make a pump, knowing that the correction was 100% and it is accumulation volume, at least it will do 20-30% jump long.
i am waiting for btc to make its move up.
nfa
dyor