MATIC - WyckoffWe are facing MATIC making the pattern Wyckoff at phase UTAD. After that the price will slowly go down until lost the box and test new supports more lowers.
MTCUSD trade ideas

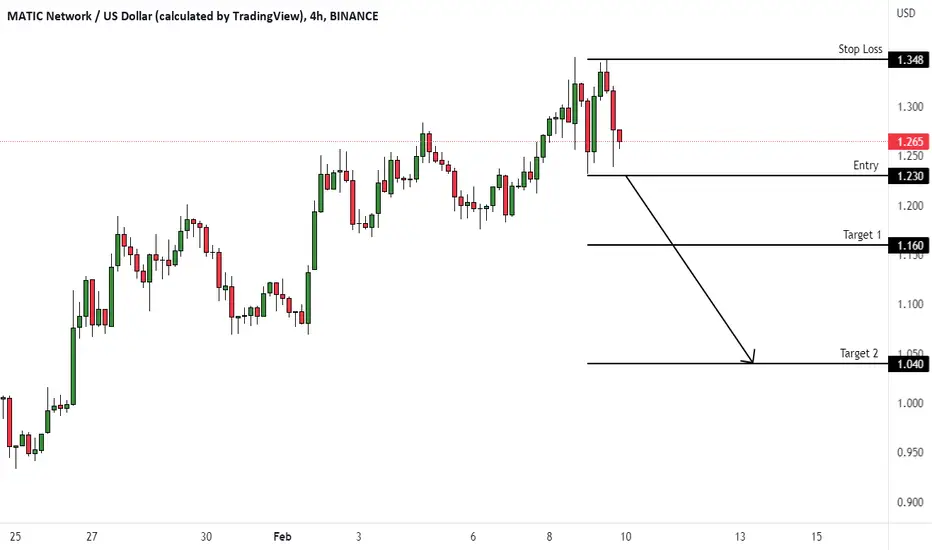
MATICUSD (4H) - Bearish reversalHi Traders
MATICUSD (4H Timeframe)
Waiting for the downward break of 1.230 support level which will complete a bearish trend reversal pattern to go SHORT. Only the upward break of 1.348 would cancel the bearish scenario.
Trade details
Entry: 1.230
Stop loss: 1.348
Take profit 1: 1.160
Take profit 2: 1.040
Score: 5
Strategy: Bearish reversal
$MATIC cup/handle?Could this be a cup/handle forming for $MATIC? Strong moves over the past couple weeks


Matic updateWhat Is Polygon (MATIC)?
Polygon (previously Matic Network) is the first well-structured, easy-to-use platform for Ethereum scaling and infrastructure development. Its core component is Polygon SDK, a modular, flexible framework that supports building multiple types of applications.


Trippy! MATIC Head & Shoulders 5 DAY INVERTED CHART!We've been in a bear trend for a while, so we are used to looking at down-trends. So..look at MATIC Polygon in the 5 Day time frame, huge Head and shoulders forming, and if this chart plays out, remember it's INVERTED target is $1.60 the common FIB 0.5 retracement of actually increase.
Really Trippy buy if you understand it Matic could have enough steam, but HOT already, Only one or 2 more 5 day periods left before a big marklet cool off, shows in BTC also.
REMEMBER INVERTED CHART

$MATIC about to break major resistance$MATIC is looking like it wants to break a major resistance level. I do believe it will be one of those coins that will surprise investors this year.
NFA / DYR

Polygon MATIC leaving the penny crypto area after last Fakeout⁉️MATIC leaving the penny crypto area after last Fakeout⁉️
Like in Stock Market the $1 mark is important for cryptocurrencies as well
Just see Polygon price reaction on the chart
Let me know your thoughts in the comments🤗
⬇️⬇️⬇️
Likes and Follow for updates appreciated🤗
Disclaimer:
Not financial advice
Do your own research before investing
The content shared is for educational purposes only and is my personal opinion

Thanks for all the trades $MATIC! Was great last few monthsI like $MATIC, A LOT
It should keep pumping BUT we moved the funds elsewhere
Wasn't done today. This was done close to $1 about a week ago, posted elsewhere
While #MATICUSDT has done well, 10%, the money has performed better elsewhere
You were great old friend, the best during the bear and last few months but looking for more BETA
#metaverse #crypto #NFT

MATICUSD Out of its scalp range, turned bullish.MATIC broke over the scalping range that dates back to July 18th. The only time it broke over it since then was on November 4th and it made a top at 1.310. As long as the price is over the range, 1.310 is our bullish target.
Follow us, like the idea and leave a comment below!!

Matic updateWhat Is Polygon (MATIC)?
Polygon (previously Matic Network) is the first well-structured, easy-to-use platform for Ethereum scaling and infrastructure development. Its core component is Polygon SDK, a modular, flexible framework that supports building multiple types of applications.

MATIC- Day Trade Hi,
Short term bull move on the Matic/USDT pair. Broke above minor support and now consolidating before the next move higher. If BTC can push up slightly more I believe that will be the catalyst for the next 10% move towards $1.12-1.15.
Oh...and its in a bullish pennant which every newbie trader loves to trade!
GL if you join

$MATIC position being closedClosed $MATIC position entirely before
If wrong, it's okay, am sure other #crypto coins will pump more if this keeps pumping
Not liking RSI atm
If it sells off decently will rebuy, again
#p2e #metaverse #nft

Matic update 2023What Is Polygon (MATIC)?
Polygon (previously Matic Network) is the first well-structured, easy-to-use platform for Ethereum scaling and infrastructure development. Its core component is Polygon SDK, a modular, flexible framework that supports building multiple types of applications.


Polygon: Holy Poly Guacamole 🥑Let's show 'em how it's done! Polygon continues to spike up and should exceed the resistance line at $1.30, if it carries on with its bullish temper. Our alternative scenario implies, that MATIC could drop below the support line at $0.689 until it reaches the end of the blue wave alt. (ii).

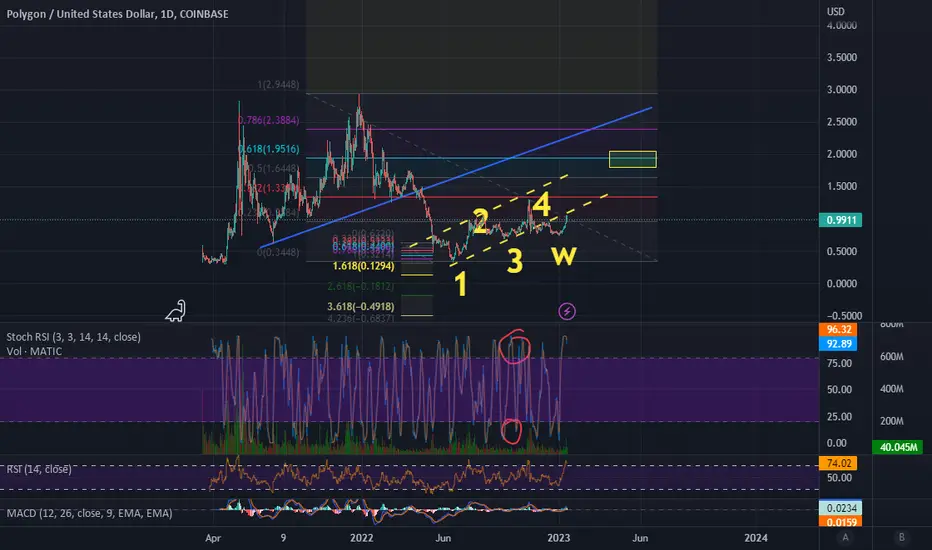
$MATIC has held up well and may be poised for more gains$MATIC has held up well over the summer of 2022 while the rest of crypto fell.
Here are 2 possible counts I'm considering that imply another rally. The first is a triangle pattern (black labels) and the second is a w-x-y combo (blue).
If its the triangle, this rally is wave (d), then a brief setback in wave (e) that leads to a powerful rally.
If its the combo, then the rally may have already started.
There is a bearish count (not shown) that is active so long as MATIC holds below the black horizontal line.

MATIC Breakin Trend lead us 0,45 0,22 AreaMATIC Breakin Trend lead us 0,45 0,27 Area
MATIC Retrace will break the line till 0,45 0,22 target

Matic update #BarendsCryptoThis is an update to my Matic chart, likely this project will the price i set months ago.
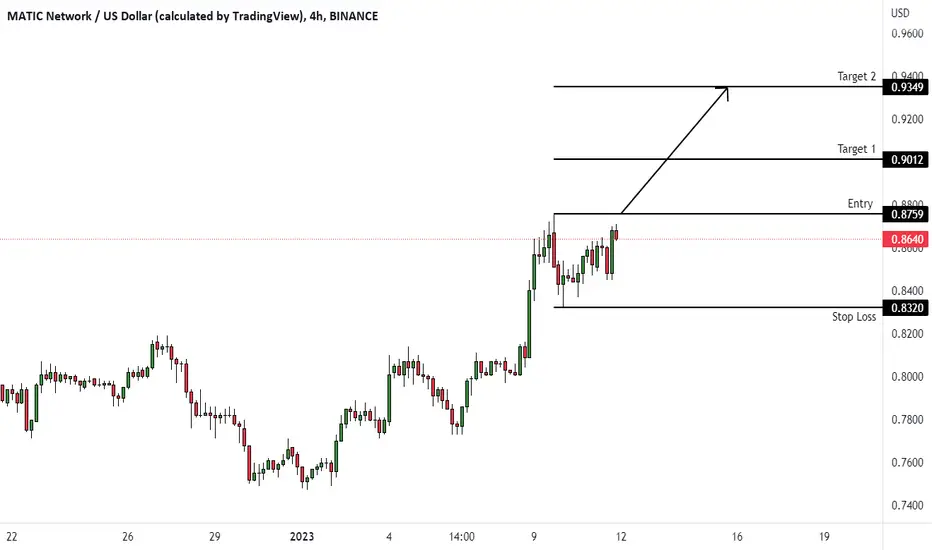
MATICUSD (4H) - Bullish breakoutHi Traders
MATICUSD (4H Timeframe)
The market is in an uptrend and we are waiting for an entry signal to go LONG above the 0.876 resistance level. Only the downward break of 0.832 would cancel the bullish scenario.
Trade details
Entry: 0.876
Stop loss: 0.832
Take profit 1: 0.901
Take profit 2: 0.935
Score: 7
Strategy: Bullish breakout
Polygon #MATIC updatePolygon (previously Matic Network) is the first well-structured, easy-to-use platform for Ethereum scaling and infrastructure development. Its core component is Polygon SDK, a modular, flexible framework that supports building multiple types of applications.

MATIC LongJust entered a long MATIC trade. Regaining the MA200 is a big deal, especially with MATIC, and is one of few tokens right now that has a long confirmation.
