POL/USDT | 1W🩸 PSX:POL ⁀➷
#Polygon. Macro chart Another
💯 Intermediate Target - $0.85
🚩 Macro Target 1 - $1.20
🚩 Macro Target 2 - $1.70
🚩 Macro Target 3 - $2.45
- Not financial advice, trade with caution.
#Crypto #Polygon #POL #Investment #L1
✅ Stay updated on market news and developments that may influence the price of Matic. Positive or negative news can significantly impact the cryptocurrency's value.
✅ Exercise patience and discipline when executing your trading plan. Avoid making impulsive decisions driven by emotions, and adhere to your strategy even during periods of market volatility.
✅ Remember that trading always involves risk, and there are no guarantees of profit. Conduct thorough research, analyze market conditions, and be prepared for various scenarios. Trade only with funds you can afford to lose and avoid excessive risk-taking.
MTCUSD trade ideas

MATIC returning to equilibrium would be a 128% gain from here!MATIC is looking extremely undervalued at current levels. The price has pulled back considerably since the "Trump election pump" and is forming a nice wedge on the 4-hour chart, which is currently on a four-count. A price move back to equilibrium from the wedge's bottom trendline would, by itself, result in approximately a 128% gain.
Longer term, if the price breaks out of the monthly chart wedge pattern (see comments below for the chart), which is also currently trading at a four-count, we could see some incredible price appreciation over the next 6 to 9 months.
Good luck, and always use a stop-loss!

MATICUSD Big Breakout Price within this triangle will lead to a large breakout
A triple bottom is the main cause for this bull situation
BULLISH LONG TERM
Matic$

MATICUSD - Bullish SqueezeOn the flip side of VARA we have this correlated asset which is + about 20% above VARA, thus there is a very high likelihood that VARA will pump should Polygon break as I predict in this diagram. There are several correlated assets that are entering into a bullish squeeze this morning, seemingly one after another. VARA has already broken out to around 10% in this regard I suspect MATIC will do the same and it will feed VARA momentum.

MATICUSD Bullish Squeeze TightensThis bullish squeeze has confirmed up to the 2 hour chart, which at this point is getting into higher time frame levels for day trade strategies. The probability of a bullish outcome remains the same at about 80% however long flat price action such as this can result in a violent expansion of the B Bands. I actually stake every coin I buy so this isn't really useful to me but thought I would share.

MATIC (Polygon), Long, 1Dentry: Current Market Price
take profit: 0.5250
stop loss: 0.0400
MATIC is currently trading within a support zone and forming a bullish flag pattern. This indicates potential upward momentum as it aims to break through the resistance at 0.4950.
buy 🚀
✅ Like and subscribe to never miss a new analysis! ✅

Polygon at Key Support Zone - Will It Bounce to 0.4700?COINBASE:MATICUSD has reached a significant support level that has previously attracted buying interest, often resulting in bullish recoveries. This level aligns with previous market reactions, highlighting its role as a key area to watch.
If the support holds and bullish confirmation emerges—such as bullish engulfing candles or long lower wicks—a move toward the 0.4700 level is anticipated. However, if the support is broken, the bullish outlook could be invalidated, opening the door for further bearish momentum.
Traders should closely monitor this zone for signs of buyer strength before considering long positions. As always, risk management is essential to mitigate potential losses.

POLYGONPolygon (previously Matic Network) is the first well-structured, easy-to-use platform for Ethereum scaling and infrastructure development. Its core component is Polygon SDK, a modular, flexible framework that supports building multiple types of applications.
We can see a triangle pattern on the chart and divergence by RSI on the weekly timeframe.

MATIC: nice setupMATIC: nice setup
-Quasimodo structure.
-ABCD pattern.
-Key level support.
-Demand zone support.
Upon breaking out of down channel, Matic will welcome Trump!
.
Wait n see!

Bullish on POL, waiting for the pump. Forming W partter.
In terms of future predictions, various crypto analysts offer differing outlooks. Coincodex expects POL to reach $3.56 by the end of 2025, while Digital Coin Price forecasts a more modest rise to $2.84 in 2025, followed by growth to $3.87 by 2026. Changelly, taking a more conservative stance, predicts that Polygon could reach $2.01 in 2025 and climb to $3.10 by 2026.

POLYGON updatePOL full send to a new ATH!
Breaking 0.285 is the stop-loss.
Passing $0.755 is the bullish confirmation.
#Polygon

MATIC long term analysis#MATIC has a nice pattern for rising there is a 5 wave correction structure which is ended and now we can expect rising waves !
in lower time frame we have a nice pattern too which you can see in my next post

Possible short term golden cross over on the HourlyMATIC previously had a double bottom and broke through the 50 EMA and now will hopefully face off and break through the 200 EMA, please see key levels on the chart, in addition, there is a possibility that there may be a golden cross over, which could possibly be good for investors/holders. Please be careful this is crypto.

Matic entering buy zone of ascending triangleentering 38.2 23.6 buy zone on ascending triangles lower part of range.
liquidity rotating to alts with this sell off/liquidity grab event.
explosive moves building

MATIC perfect correction #MATIC made a huge 5 waves correction structure like ABCDE this can cause the market rise alot and hit the highest ath and even higher !

MATIC Super rise !#MATIC made a nice pattern for its long term correction like ABCDE after that market can rise and hit its last highs !

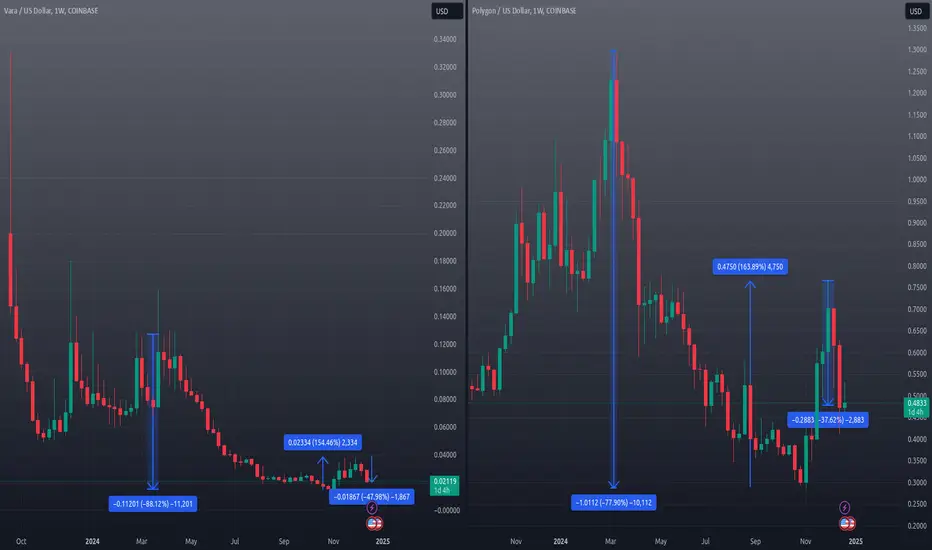
VARAUSD and MATICUSD Correlation PointsVARAUSD dropped a massive 85% after initial pump when listed on Coinbase. We will mark this bottom as correlation point 1 even though as I will demonstrate the market for VARA is out of balance and is due a significant pump.
On the left VARA percentages are shown.
On the right MATIC percentages are shown.
In march notice that from the correlated high (not the ultimate high) from march until November VARA dropped 88%.
In the same time period MATIC dropped a significant 78%. This leaves VARA at this point a negative 11%
The pump TRUMP PUMP that started in november delivered a 154% pump for VARA and a 163% pump for MATIC a difference of negative 11% roughly. Currently, VARA remains 10% negative to MATIC. This is not the result of VARA being a less favorable buy but rather that due to it's low market cap movements are exagerated and wild.
In this regard the Market owes VARA approximately 10% to 20% upward movement which will come unless VARA pulls MATIC down to an equivalent level.
With regards to correlation, both assets pull upon each other like the moon and the earth pull upon each other. One is bigger and has more impact on the other but ultimately persistance of the lesser or smaller asset can aggressively pull the other down especially when very large market moving INDEXES such as DXY and BTC have substantial negative moves.
Currently today at close last night, DXY and USDX closed high again hitting a very heavy resistance zone. This is bullish for BTC which is why between today and Tuesday we could see BTC move up again.
This along with negative movement in the FX currency markets our altcoin and risk assets could finally see a little bit of light since we several markets have come to a head and a decision point.
I am not a financial advisor, stay safe my friends.
VARAUSD and MATIC - Further Comments on CorrelationAs you can see whenever MATIC and VARA prices decended following that last pump the initial difference in price drop from the local high to local low was VARA 12% loss in price and MATIC 10% in price roughly.
This morning VARA pumped and has now normalized it's correlation with MATIC having now just under a 10% drop in price on average from the local high to current price.
On an average day correlated assets move together and stay within a small percentage point of the same price point.
I am not a financial advisor, be careful my friends.
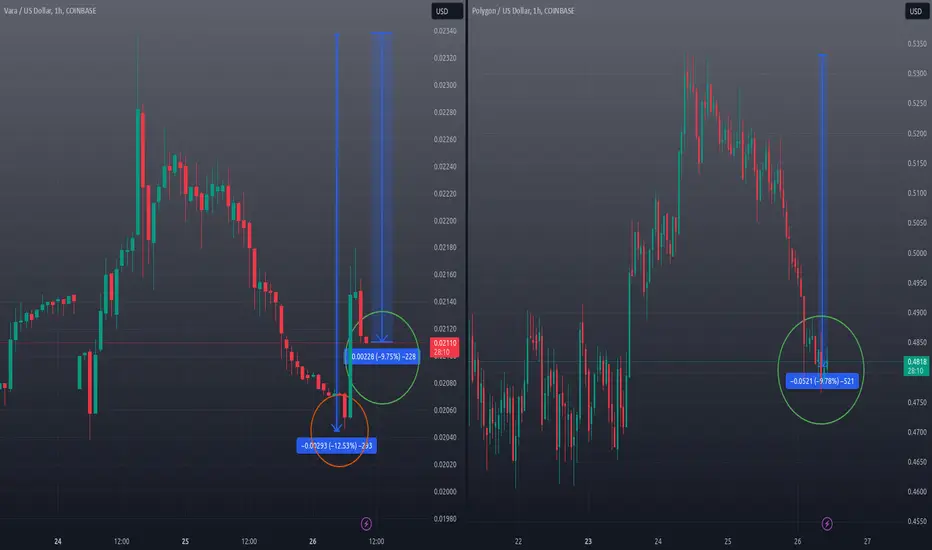
VARAUSD How To Spot Manipulation - Correlation and ConfluenceFocusing only on the set of candles inside of the green box. Notice how VARA pumped in the early hours of the morning. At that time however MATIC was in the process of an indecision candle and even signaling a drop in price. Following this little pump MATIC remained flat and VARA quickly began descending down to its corrected average level.
I consider this as manipulation because even though it probably isn't the fact that large buy orders impacted the price at a percentage that is high enough to awaken breakout traders who make a habit of buying early morning breakout moves.
It just goes to show that on an average day one should consider correlation in their decision making as well as comparison with the other correlated markets such as DXY, BTC, and the stock indexes. Confluence can strengthen a traders decision to buy especially if order flow data agrees with the trade.
I am not a financial advisor, be careful my friends.

MATICUSD - Large Double BottomPrice is reaching this area that has previously been seen as support
Suggesting another bottom here, creating a double bottom
This will lead price to new highs
Price is waiting to pop off

StructureIs it possible that price can break out the triangular structure and go to the VAH on the VRVP, or fall deep into the Demand Zone on the bottom of the BB(Bollinger Bands)?Currently at this time the candle is bearish watch out for strength of breakout of the triangular structure. Be safe

VARAUSD vs MATICUSD - This is a bull flagIf you only trade the VARA chart without understanding how the market is trading within the lines of correlation, you will mistaken one pattern for another. The two market patterns I have circled are both bull flags. The problem is that VARA has a much lower amount of liquidity i.e. standing buy orders to support lower order walls.
This causes patterns on this chart to become smeared. This is why a trader must always compare against correlated assets. Which is why my chart will often have Polygon right up next to VARA even though VARA is probably going to show a little tigher correlation with Polkadot. It is a preference I.
DXY, USDX, and a number of other indexes correlate to Bitcoin however often either against or with and overall doesn't change much on the daily. It doesn't take long to see correlation since often whenever USDX or DXY goes up JPYUSD or BTC will fall. Reverse correlation most of the time although JPYUSD has been a bad example overall since that asset typically tanks long term.
And going back to the current chart, the chart patterns are ugly and the overall market structure is full of volatility, fear and greed. I use this to my advantage.

TradeCityPro | MATIC(POL) Fresh Look at MATIC During Christmas👋 Welcome to TradeCityPro Channel!
Let’s analyze POL, formerly known as MATIC, due to your frequent requests. 😊
🌐 Overview Bitcoin
Before starting, let’s take a look at Bitcoin. In the 1-hour timeframe, it is currently fluctuating below the 98807 resistance. This resistance has been tested multiple times, indicating a high probability of breaking through.
It seems likely that Bitcoin dominance will increase along with this potential upward movement. Therefore, it might be better to either
Open a position on Bitcoin itself, Look for altcoins that show a bullish trend against Bitcoin and take triggers to open positions, Just make sure to watch out for Bitcoin’s low volume.
📅 Weekly Timeframe
MATIC, which once ranked well in the market, is now underperforming. The repeated blockchain hacks have caused significant damage to its ecosystem, leading to the rebranding from MATIC to POL.
MATIC could have remained among the top 10 coins, but poor project management caused DeFi activities and TVL to shift to platforms like Solana, SUI, and Base.
Personally, I wouldn’t consider buying MATIC unless its DeFi ecosystem becomes active again. For those interested in purchasing, buying above 0.7629 could be an option, but only if the volume increases for both the coin and its chain.
If you have been holding MATIC for some time, I suggest selling below 0.3636 in the weekly timeframe. On lower timeframes, I can suggest other exit points. Alternatively, you can use DeFi platforms to create USDT liquidity using borrow & lend mechanisms.
Note that MATIC faked the 0.3636 support and rebounded with a bullish engulfing candle, creating a new upward move. Personally, I might become interested in this coin after 1.2457.
🌞 Daily Timeframe
After bouncing from 0.2922, MATIC had a solid upward movement. However, most coins experienced similar trends, so it cannot be said that MATIC outperformed.
If the price doesn’t drop below 0.4738, it can be considered a sign of gradual recovery. This level is significant both from a Dow Theory and Fibonacci perspective. If 0.5794 resistance isn’t broken and the price gets rejected, there is a high probability of losing the 0.4738 support.
I recommend selling your holdings if the 0.4738 level breaks and you have purchased at higher levels. However, if your entry was at 0.3623 or lower, you can continue holding and exit risk-free.
⏰ 4-Hour Timeframe
MATIC is currently stuck below the 0.5316 resistance and fluctuates within the range of 0.4654 to 0.5316.
📈 Long Position Trigger
I would personally avoid this coin due to its low volume. However, after breaking 0.5316, you can open a risky long position if you’re comfortable with the risk. I’d still prefer to long Bitcoin instead.
📉 Short Position Trigger
given the weak condition of this coin, you can consider opening a short position below 0.4654. Keep in mind that your short trades should have quick profit-taking and small stop-losses to exit the market efficiently.
📝 Final Thoughts
Stay calm, trade wisely, and let's capture the market's best opportunities!
This analysis reflects our opinions and is not financial advice.
Share your thoughts in the comments, and don’t forget to share this analysis with your friends! ❤️
