IF possible for a chance of higher high... my first chart MATICDefinitely my first time doing this with MATIC and hopeful it's all in possible
MTCUSD trade ideas

MATIC/USD: ATH soonHello everyone !
Hello crypto community !
Merry christmas to all
This analysis is my personal opinion ,not a financial advice ,so do your own research.

4 Crytos we're buying BIG TIME!Hey all, in this video we go over the 3 crypto assets we're buying big time!
XRP, Solana, ETH and MATIC are the trades were in!
The video explains better why

Polygon Under Radar after Collab with UniswapAt this point, the price is in a rising channel, and currently hurling around an all-time high and the resistance of the rising channel. We could see a sharp rally towards $3 if it breaks out. Otherwise the correction towards $2.10 will be imminent before moving further up.

Three rising valleysBreakout of the three rising valleys pattern, breakout is from the height of the second peak. I had it running up at least 40% but I don’t think it’s going to break that trendline and previous high resistance line

MATIC - breakout targetsMATIC is about to breakout and challenge resistance levels... here are the ones I see:
2.72 - Previous ATH/ price discovery
2.85 - Uptrend
3.61 - Uptrend
4.35 - 1.618 Fib from genesis to 1.0 @ previous ATH
MATIC is a beautiful beast benefitting both from L2 on ETH and in its own right as a competing layer 1 (SOL, AVAX, etc.)
2022 should be a stellar year for MATIC, Many are calling for $10 and that looks completely in the cards as a BoT.
I'd look to sell chunks at $4.35, $7.00, and $9+.
If you see a return to touch the orange bull market support line at ~$2 ... that has been a great opportunity to buy.

Trade setup in Matic: Short, withHere is a pretty self explanatory Matic short setup chart with levels marked.
Even though Matic is currently in an uptrend, I spotted a bearish rising wedge pattern, which can potentially break down.
Note: As per trading best practice, it's best to take a trade after completion of the pattern (as of now, the pattern is still not valid because the wedge is still not broken), but the risk: reward is decent, and there is a nasty wick (bearish) on the 1H and 4H chart, which just convinced me to take the trade.
Disclaimer: None of this is financial advice. If you wish to take the trade, make sure you are first comfortable of losing amount if your stoploss is hit. Please manage your risk accordingly.
Happy trading. :)

Polygon at resistance levelCOINBASE:MATICUSD price has reached the previous high. I would like to see it break above this level, $2.80 is what I'm looking for.
Follow for more chart analysis.


Revised! New breakout date Dec 7I will always be first to raise my hand and say, "maybe I drew that one wrong"
Because of the price action overnight in Matic, I woke up very excited to revise this chart and draw a new backwards Fibonacci retracement box. I will be the first to admit if my initial posts from earlier this week were incorrect, and actually I hope they are! Because this chart revises both the breakout target and the Fibonacci extensions to more aggressive targets. A sneaky, cheeky trendline has appeared and I think it might be right. In the drawing above, I changed the Fib 1.0. to 2.83 (the high on May 18) instead of the 2.44 I had been using. It's a more traditional charting technique to take that high wick anyways. So that presented new Fib levels and a new trendline. The aggressive accumulation on the last few days looks like other pre-breakouts I have seen. Any close above 2.44 busts my initial prediction of an Xmas breakout and I would be more than happy with that. Dec 7 is more exciting anyways. My thoughts today while I sit at work drawing charts are: have I accumulated enough? Should I roll other coins into Matic? Is a more aggressive trendline more realistic?
Have fun, best of luck. Let's see what happens!
Due your own due diligence. Not financial advice. Just pretty pictures. Have fun.

STRONG UPTRENDMATICUSD the price moves in a strong uptrend making HH and HL's. Trading in ascending channel we expect strong bull moves.
Stoploss below yellow line.

$4 mattic by Jan 19?I have overlayed ETH 2017 price action to Matic atm. If this fractal plays out, $4 mattic is possible by Jan 19

Matic short setup target is $0.7this scenario depend on btc movement and it will be void if btc become bullish.
target 1: $1.7
target 2: $1.4
Target 3 : $1.2
target 4: $0.7

Polygon Price AnalysisIn isolation, Polygon’s prospects look constructive. However, my concerns are regarding the market as a whole. Bitcoin’s price action is sluggish and is likely to remain that way for the foreseeable future. Furthermore, due to the FOMC’s hawkish taper timeline, broader macro conditions are breaking down.
Subsequently, the tailwind for crypto prices is dropping off. Furthermore, trading conditions are likely volatile and illiquid over the festive period. Therefore, Polygon could experience wild swings in price over the next two weeks. That’s why, in my opinion, closing or reducing profitable trades into year-end is often a sage move.
If the market turns lower, a logical destination for the MATIC price is the 200-DAY Moving Average at $1.443, around 40% below the current price. Looking at BTC and Ethereum today, the chances of Polygon testing $1.443 in the next week or so is high. Furthermore, a broader market risk-off could extend MATIC towards $1.000
Of course, cryptos often defy logic, and on that basis, Polygon could continue higher even if the market turns. Subsequently, a close above $2.500 invalidates my bearish view.
Hello, community, please if you like my ideas do not forget to support them with your likes and comment, and you can also get in touch for daily signals and alerts.

Rising wedge forming on Matic ? We have little data available, despite this the weekly chart offers us a rising wedge with a negative breakout around January / February .
Major support around 0.61 Fibonacci from the first run at $ 1.13
Moment around which according to my latest analysis on BTC it too should touch its major support before continuing with a large positive rebound .

MATIC testing a support trendlineProceed with caution. MATIC seems to have closed below the lower support trendline on the hourly scale. Watch out for a re-test of this support, but we could be on our way to $1.75 - $1.85.

Reasonable for MATIC to reach $3.00 within the next yearStrong healthy uptrend from the start, no parabolic movement since May 14.
MATIC is finding support around $2.00, we may not have many more opportunities for an entry price below that level of support before the next upward movement.
The chart indicates that short-term downward movement may be likely to continue, providing investors a more ideal entry point before new ATH is possible.
The price action of 10x is unlikely because it would require MATIC to have a market cap ratio to bitcoin of 20% at BTC present-day value.
This token has plenty of room to increase in value and a low chance of fading out in the near future. It will be reasonable for MATIC to reach $3.00 within the next year.

MATICUSD (Daily) Bullish wave We2Hi Traders
MATICUSD (Daily Timeframe)
A Med-High probability, entry signal to go LONG was given at 2.24 after the market found support at 1.71. Only the downward break of 1.71 would cancel the bullish scenario.
Trade details
Entry: 2.24
Stop loss: 1.71
Take profit 1: 3.08
Take profit 2: 3.93
Score: 7
Strategy: Bullish wave We2

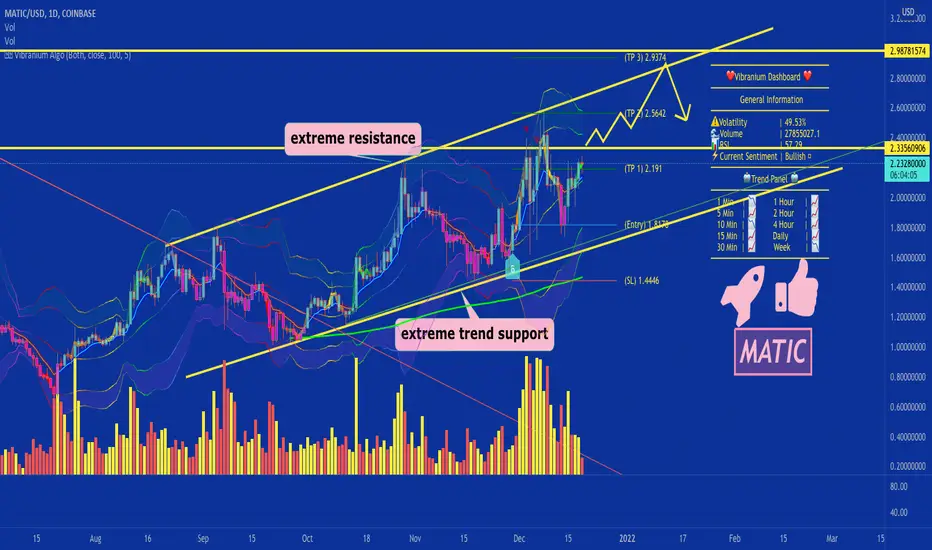
The competition cannot compete 🦉Matic is still in this very strong trend channel, also holding highs while bitcoins at support and many other alt coins are near support or lows depending on the ticker. This just shows us how strong it really is compared to the competition. ⍼
over the 2.35 local resistance we can target 2.5642-2.9374
like and follow for more 💘
Looking good for MaticBased on all the positive surroundings of matic this coin is set to explode will need to get support above 2.76 then boom gaming metaverse I think this will be the next coin to get a Solana like push to the top sit back and watch cause matic is primed for a take off

Polygon (Matic) To Retest ATH, Next Stop price discovery 🚀Polygon (Matic) To Retest ATH, Next Stop $3.24 @ 127.20% Fibs currently only 55% gain away from the current price. Polygon (Matic) is currently only 29% from the ATH @ $2.88..we need a clear breakout above the 78.60% fibs, a daily close above this key level of resistance would turn the 78.60% fibs into a strong support level for the next Matic parabolic run as it looks set ready for price discovery with all the latest developments & looking at the price action 🚀
Our current price Targets for Polygon from the current price:
127.20% Fibs at $3.47 (55% Gain)
161.80% Fibs at $4.22 (90% Gain)
261.80% Fibs at $6.41 (187% Gain)
461.80% Fibs at $10.78 (380% Gain)
Please see previous analysis below. Happy Trading :)
Polygon (Matic) Update 07/12/21: Matic has shown great strength since the crash on the 4th December, recovering +63% from the -35% drop experienced. This project has very strong fundamentals with some of the most cutting edge technology in Blockchain Technology today. This is Ethereum's Internet of Blockchains, although Matic has already grown 12514.5% YTD, we can expect similar growth pattern to Solana.
Since the July crash, Matic has been fighting some heavy resistance from the previous key price levels @ the 23.60%, 38.20% & 61.80% fibs from the sensational run we experienced during the early months of this year. on the 14th October our A.I script triggered a strong buy signal on the daily chart @ $1.30 just below the 23.60% fibs. Since the Buy Signal triggered, Matic has grown 89% in just under 54 Days. Matic's first impulsive wave topped just above the 61.80% fibs ($2.14). As mentioned in previous analysis, Polygon's move back to the ATH is not one which is going to be straight forward due to the nature of the explosive move earlier this year and will face some key resistance on this push phase back to the ATH @ $2.88, which is now only 14% away from the current price @ $2.48.
From the current price level Matic has some strong support at $1.91 & $2.14, a strong bullish continuation pattern is in play for Matic and we can expect to reach our price target at the 127.20% fibs @ $3.47 sooner than you may think, currently only 37% gain away. It is very important for Polygon to flip the 78.60% fibs ($2.41) key resistance into Key Support for this continuation pattern back towards the ATH and the 127.20% fibs.
Polygon (Matic) Update 03/11/21: The last breakout from this tweezer chart formation gave us 77% gains, if this trend continues we can expect to see Polygon (Matic) above $3.69 and heading towards our target at the 161.80% fibs @ $4.22 (104% away from the current price).
Polygon (Matic) Update 28/10/21: $1.63 was the last critical resistance which Matic has now flipped into support above the $1.77, it’s going to be interesting to see just how quick Matic retest it’s previous ATH set in May as Matic is currently only 48% away from $2.87, from here we have the following price targets:
127.20% fibs @ $3.47 (80% Gain from the current price)
161.80% fibs @ $4.22 (119% Gain from the current price)
227.20% fibs @ $5.66 (192% Gain from the current price)
Please see previous analysis below. Happy trading :)
Polygon (Matic) Update 23/10/21: Polygon (Matic) is currently 86% from the ATH @ $2.87 and 174% to the $4.22 target. From the current price we are currently 555% away from Polygon (Matic) at $10, we can expect to surpass this peak bull cycle it's going to be an explosion 🚀
Our current price Targets for Polygon from the current price:
127.20% Fibs at $3.47 (127% Gain)
161.80% Fibs at $4.22 (177% Gain)
227.20% Fibs at $5.66 (270% Gain)
423.60% Fibs at $10.04 (555% Gain)
Please see previous analysis below. Happy Trading :)
Update 16/09/21: Polygon (Matic) To Retest ATH , $4.22 Price Target @ 161.80% Fibs. Matic is looking extremely healthy currently trading just below the key support level at the 38.20% fibs. We are looking extremely healthy for a continuation trend back to the ATH at $2.87. Our target after a retest of the ATH is at the 161.80% Fibs at $4.22 (157% Gain from the current price level). Please see previous analysis below. Happy trading :)
Polygon (Matic) has found strong support @ $1. Since the May crash Matic has been on a slow downward trend from the top @ $2.85 and bottomed out @ $0.64. Currently Matic is trading @ $1.47 and if Matic can flip this key resistance above the 38.20% fibonacci level into support above $1.77, Matic looks poised for a big move (95% back to ATH ) from this support zone . 185% Gain to the 161.80% Fibonacci target @ $4.22. See previous analysis below. Happy Trading :)
Polygon (Matic) Script Buy Signal triggered EMA Crossover SMA Confirms the Bottom and Reversal in Price back to May Highs near the ATH (145% Gain). See previous analysis below. Happy Trading :)
Polygon (Matic) has found strong support @ $1. Since the May crash Matic has been on a slow downward trend from the top @ $2.85 and the bottom @ $0.64, currently Matic is trading @ $1.04. Matic looks poised for a big move (175% back to ATH ) from this support zone . Happy Trading
Polygon (Matic) Update: 05 /08/2021: To Retest ATH @ $2.72 , Next Stop $3.24 @ 127.20% Fibs, then $3.94 @ 161.80% Fibs and $5.26 @ 227.20% Fibs. 121% Gain from current price to the 127.20% Fibs @ $3.24. Matic has been performing extremely well despite the blood on the streets...See previous analysis below. Happy trading :).
$Matic $Polygon
See Previous Analysis Below:
Matic New ATH $2.70 🎯(80% Gain from Buy Zone) Update: 18/ 05 /21 See previous analysis below. Happy trading :)
Polygon (Matic) Update: $1.78 Target Hit. Next Stop $2 at the 161.80% Fibs. 20% Gain from current price level to $2. Next Target after $2 at $2.58, 54% Gain from the current price level. See previous analysis below. Happy Trading :)
Polygon (Matic) Update 14/ 05 /21: Matic in Price discovery , our next target price $1.78 at the 227.20 Fibonacci extension . Targets Hit $1, $1.30, Next Stop $1.35 (7% Gain). With this continued momentum to the upside, it is a 43% Gain from current price level @ $1.24 to the 227.20% Fibonacci extension at $1.78. See previous analysis below :)
Polygon (Previously known as Matic) Update 27/03/2021) poised to test another New ATH @ $0.67 (15% Gain) from the current price @ $0.58. On the 25th April the 13 EMA crossed up above the 50 SMA signalling a strong buy signal, Polygon gained 70% from this parabolic move back to the ATH levels which were tested last in early March. Our next price target from here is $0.80 (37% Gain) to the 161.8% Fibonacci level. See previous analaysis below :)
Polygon (Previously known as Matic) Update 25/03/2021) poised for another test of New ATH @ $0.67 (93% Gain)
Polygon (Matic) poised for another test of New ATH @ $0.67 (93% Gain). From Buy Zone 1 Matic has retraced 18% and is now sitting in our Buy Zone to DCA and accumulate. If we continue to retrace to the 23.60% Fibonacci level, expect an explosive move back towards the 61.80% Fibonacci level @ $0.43 (47% Gain). Since reaching the ATH we have failed to break past the 61.80% level but a further retracement to the 23.60% should get the Bulls back in the market and we can expect to finally break through this level after 4 failed attempts from the current ATH . Huge parabolic move still on the cards here, be patient, DCA if you are already riding the wave or look to enter for a potential 93%+ Gain. See previous analysis below. Happy Trading :)
Update 20/03/2021
Since reaching a new ATH @ $0.57 after a Buy signal came from our script, Matic retraced down to $0.32 and is currently sitting in our Buy Zone to re-enter Buys to DCA /Accumulate at the 38.20% Fibonacci level @ $0.35. We expect another huge parabolic move for Matic to test the previous ATH @ $0.57 and further push towards the 127.20% Fibonacci level @ $0.67 in search of a new ATH , there is a potential Gain of 93% from the current price level. Be patient use current Buy zones to enter or re-enter to DCA /Accumulate from the current price level. Current Stochastics show an extremely oversold market and we are confident Matic will be in search of new highs in the coming days. Happy Trading :)
Update 20/03/2021
Nice set up from Buy Zone 1, potential test of the 50 SMA before bouncing back to the upside. #MaticUsd
*Update* Matic has hit our 161.80% Fibonacci Target @ $0.58. Great buy for everyone that got in and accumulated more coins at the critical buy zone areas.
Polygon (Matic) Buy Opportunity! Potential 68% Gain. Great Performance throughout the past month from Matic, this cryptocurrency is showing very strong continuation bullish momentum with HH and LL in a bullish range growing just over 240% over the past month. Matic seems to have found some resistance short-term between the 61.80%-78.60% showing indications of a weak retracement. Buy zone from current price level at 50% ($0.37) Fibonacci level for a sniper entry, but will also be looking to accumulate more coins around the 50% Fib level. Wait for price action, further confirmation from Stochastics showing oversold market before entering any Buys. Potential 68% Gain from Buy Zone 1 to 127.20 Fibonacci Level @ 0.68. The road to $1 Polygon (Matic) is clear. Use buy zones to map out your buys and DCA to accumulate more coins.
What is Polygon?
Previously known as Matic Network, Polygon is a framework for building interconnected blockchain networks.
It seeks to address some of Ethereum’s major limitations—including its throughput, poor user experience (high speed and delayed transactions), and lack of community governance—using a novel sidechain solution.
Rather than being a simple scaling solution like its predecessor Matic Network—which uses a technology known as Plasma to process transactions off-chain before finalizing them on the Ethereum main chain—Polygon is designed to be an entire platform designed for launching interoperable blockchains.
Through Polygon, developers can launch pre-set blockchain networks with attributes tailored to their needs. These can be further customized with a growing range of modules, which allow developers to create sovereign blockchains with more specific functionality.
Key Notes:
The race is on to be the first interoperability solution to go fully live. Polygon’s proof-of-stake chain and Plasma scaling solution are live, but developers can’t yet launch their own standalone or shared security chains on Polygon until these features are released. Likewise, neither ZK-rollups nor optimistic rollups have been launched on the network, with Plasma currently the only scaling solution available on Polygon.
Polygon’s rivals are also rushing to go live with their offerings. As of March 2021, Polkadot has yet to launch public parachains; and while Cosmos’ Stargate upgrade has seen the launch of its Inter blockchain Communication Protocol ( IBC ), it won’t become fully operational until IBC transactions are enabled on the network.


Mid time frame analysis and graph of matic priceMid time frame analysis and graph of matic price
Comment/dm ideas on improvement
