MTL Rebuy Setup – Perfect Entry Ahead! (3D)MTL (Metal DAO) is currently developing within Wave C of a classic diametric pattern, based on Elliott Wave theory. This structure suggests a high-probability corrective phase that typically leads to sudden and sharp movements before a potential reversal.
As of now, MTL has not yet reached the identified green buy zone, but price action is approaching it. This zone has been highlighted by analysts as a major area of interest for a potential rebuy scenario once touched, based on market structure and historical behavior.
Importantly, the setup includes a clearly defined invalidation level. If the price closes a daily candle below this invalidation level, the current wave count would no longer be valid, and traders should reassess the market outlook.
Until this invalidation occurs, the current count remains intact, and market participants may monitor the ongoing price action for potential bullish continuation after Wave C completes.
For risk management, please don't forget stop loss and capital management
Comment if you have any questions
Thank You
MTLUSDT trade ideas

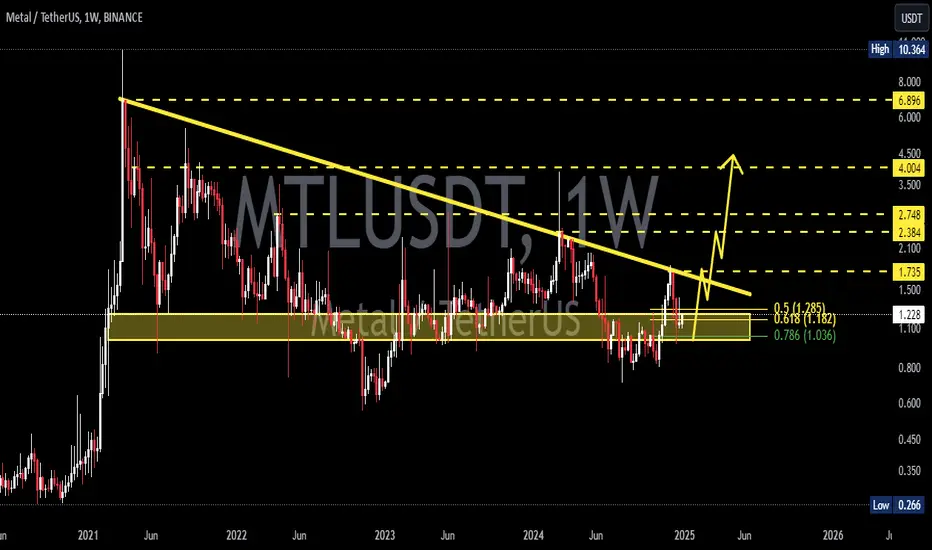
MTLUSDT // Cup handle formationAlthough there is a cup-handle formation on the chart, the targets are determined according to Fibonacci. As a formation condition, we need closings above 0.804.

MTLUSDT 1WMTL ~ 1W Analysis
#MTL Buy gradually from here with a short -term target of at least 20%+.

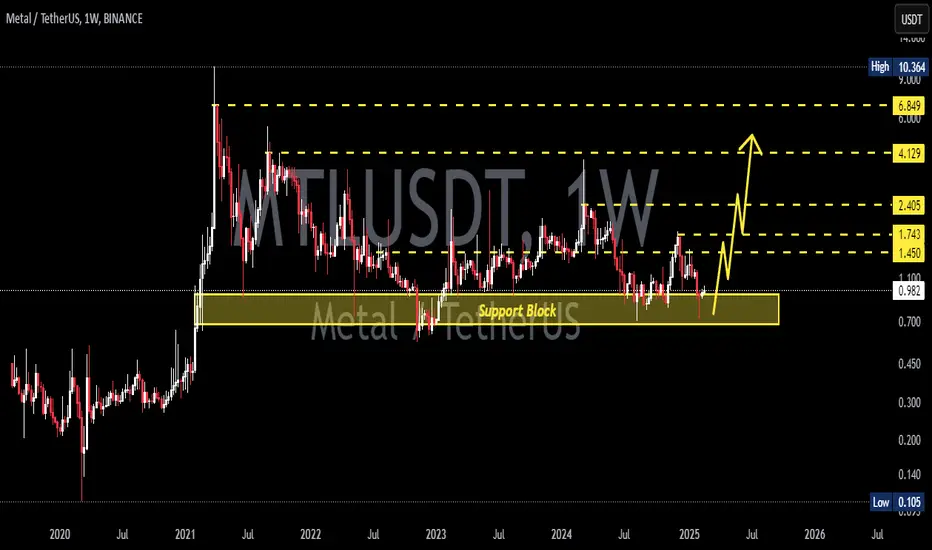
MTLUSDT 1WMTL ~ 1W Analysis
#MTL So far it continues to maintain this support block. Buy gradually from here if you still have a Conviction on this Coin.
MTLUSDT | AN OPPORTUNITY MIGHT OCCUR BUT BE CAREFUL!MTLUSDT looks strong, although there is a possibility of clearing the monthly liquidity line below.
In the S/R Flip area shown in the chart,
You can enter when the resistance in the support area, which is currently working as resistance, is broken with volume and turns into support.
Low Timeframe Entries: Looking for confirmation on smaller timeframes after liquidity clearance.
S/R Flip Confirmation: Waiting for the current resistance to break with volume and turn into support before entering.
A couple of things to watch for:
If liquidity is taken out below and price reclaims a key level, it could indicate strong bullish momentum.
Volume confirmation is key, fakeouts are common if the breakout lacks strong participation.
Monitoring order flow and wicks can help identify potential reversals.
Let me tell you, this is something special. These insights, these setups—they’re not just good; they’re game-changers. I've spent years refining my approach, and the results speak for themselves. People are always asking, "How do you spot these opportunities?" It’s simple: experience, clarity, and a focus on high-probability moves.
Want to know how I use heatmaps, cumulative volume delta, and volume footprint techniques to find demand zones with precision? I’m happy to share—just send me a message. No cost, no catch. I believe in helping people make smarter decisions.
Here are some of my recent analyses. Each one highlights key opportunities:
🚀 RENDERUSDT: Strategic Support Zones at the Blue Boxes +%45 Reaction
🎯 PUNDIXUSDT: Huge Opportunity | 250% Volume Spike - %60 Reaction Sniper Entry
🌐 CryptoMarkets TOTAL2: Support Zone
🚀 GMTUSDT: %35 FAST REJECTION FROM THE RED BOX
🎯 DEXEUSDT %180 Reaction with %9 Stop
🐶 DOGEUSDT.P: Next Move
💎 ETHUSDT.P: Where to Retrace
🟢 BNBUSDT.P: Potential Surge
📊 BTC Dominance: Reaction Zone
🌊 WAVESUSDT.P: Demand Zone Potential
🟣 UNIUSDT.P: Long-Term Trade
🔵 XRPUSDT.P: Entry Zones
🔗 LINKUSDT.P: Follow The River
📈 BTCUSDT.P: Two Key Demand Zones
🟩 POLUSDT: Bullish Momentum
🌟 PENDLEUSDT.P: Where Opportunity Meets Precision
🔥 BTCUSDT.P: Liquidation of Highly Leveraged Longs
🌊 SOLUSDT.P: SOL's Dip - Your Opportunity
🐸 1000PEPEUSDT.P: Prime Bounce Zone Unlocked
🚀 ETHUSDT.P: Set to Explode - Don't Miss This Game Changer
🤖 IQUSDT: Smart Plan
⚡️ PONDUSDT: A Trade Not Taken Is Better Than a Losing One
💼 STMXUSDT: 2 Buying Areas
🐢 TURBOUSDT: Buy Zones and Buyer Presence
🌍 ICPUSDT.P: Massive Upside Potential | Check the Trade Update For Seeing Results
🟠 IDEXUSDT: Spot Buy Area | %26 Profit if You Trade with MSB
📌 USUALUSDT: Buyers Are Active + %70 Profit in Total
🌟 FORTHUSDT: Sniper Entry +%26 Reaction
🐳 QKCUSDT: Sniper Entry +%57 Reaction
📊 BTC.D: Retest of Key Area Highly Likely
This list? It’s just a small piece of what I’ve been working on. There’s so much more. Go check my profile, see the results for yourself. My goal is simple: provide value and help you win. If you’ve got questions, I’ve got answers. Let’s get to work!

MTLUSDT 1WMTL ~ 1W
#MTL If you still have Conviction on this coin,. Buy gradually within this support block,. with a target of 20%+
#MTL/USDT Ready to go higher#MTL
The price is moving in a descending channel on the 1-hour frame and sticking to it well
We have a bounce from the lower limit of the descending channel, this support is at 1.10
We have a downtrend on the RSI indicator that is about to be broken, which supports the rise
We have a trend to stabilize above the moving average 100
Entry price 1.15
First target 1.19
Second target 1.22
Third target 1.27

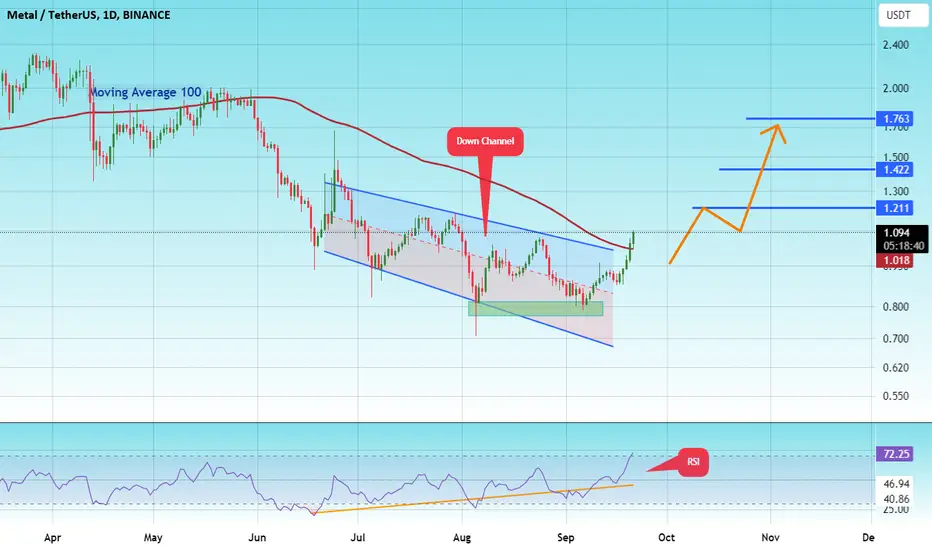
#MTL/USDT#MTL
The price has broken the descending channel on the 1-day frame upwards and is expected to continue.
We have a trend to stabilize above the 100 moving average again.
We have an upward trend on the RSI indicator that supports the rise by breaking it upwards.
We have a support area at the lower limit of the channel at a price of 0.0780.
Entry price 1.00.
First target 1.21.
Second target 1.42.
Third target 1.76.
Metal DAO (MTL) about to print a 2500% move?On the above weekly chart price action has corrected over 90% since early 2021. A number of reasons now exist to be long, including:
1) Price action and RSI resistance breakouts.
2) Support and resistance. Look left. Price action has now confirmed support on past resistance.
3) A weekly life cross prints.
4) Lastly, price action has exited a bull flag. The extension measures a 2500% move to target.
Is it possible price action continues to correct? Sure.
Is it probable? No
Ww
Type: Trade
Risk: <6%
Timeframe for long: This month
Return: 2500%

MTL/USDT is on the verge of a big breakout!🚀 MTL/USDT is on the verge of a big breakout! 🚀
The MTL/USDT trading pair is showing promising signs of a potential breakout as it nears a critical resistance level. 📈 If it manages to break through, it could spark a strong bullish rally, driving prices higher. 🔥
💡 Here’s what to watch for:
- Key resistance levels: A breakout above this level could signal the start of a new bullish trend, paving the way for significant upward movement. 🚀
- Trading volume: Keep an eye on buying volume, as a surge could indicate growing market interest and support for a breakout. 📊
- Market sentiment: Pay attention to overall market trends, as they may influence the strength and continuation of the breakout. 🏦
👀 Stay tuned: This setup could provide a great opportunity for traders looking to capitalize on a potential upward trend. However, always remember to trade responsibly and manage your risk. 🧐
⚠️ Disclaimer: This is not financial advice. Always do your own research (DYOR) before making any investment decisions.

Metal Grew 9,770% Against Tether (USDT) In 2021, Peaked In MarchConsolidation since November 2022, that's almost two years old. The upper trendline (blue) of the widening channel has been challenged three times, perfectly. Metal (MTLUSDT) just tested the lower trendline and so far it holds as support. This trendline being tested produces a long-term higher low and the stage is set for the next bullish wave.
The last major peak for this pair happened 3.5 years ago and we are ready for a new one. We are ready, the chart is ready, the market is ready. It will take some time to develop but look at past history... It will start to go slowly up but surely, as it has been doing already for years. Then, without warning, it will start to grow strong.
It is interesting to note that Metal peaked in March 2021. This is much sooner than so many other pairs. Again, this is awesome/great. We can enjoy pairs like this one with thousands of percentages of points of growth (this one grew 9,770%) and then enjoy another one and another and another one; on and on and on.
Long-term higher low leaves the doors open for a new All-Time High... We are talking about $27 as the next target, or, ~2600% potential for growth.
I don't know how high it will go.
We don't know if it will hit a new All-Time High or not.
But it is going up...
Cryptocurrency is going to grow.
The Altcoins are going to grow.
We are going to grow.
We are growing now.
And we are ready for more.
We are only getting started.
Welcome... And thanks a lot for your continued support.
... I am having so much fun...
Namaste.

#MTL/USDT is rejecting from the Diagonal Trendline multiple time#MTL/USDT is rejecting from the Diagonal Trendline multiple times in 1-Hour TF!
LSE:MTL needs to clear the Diagonal Trendline to turn bullish. The local resistance level is $1.165, and the support level is PWL $1.016.

MTL looks bearishMTL seems to be completing an ABC.
We now seem to be at the end of the b/x wave from B.
The best range for sell/short positions is the red range.
The targets are clear on the chart.
Closing a daily candle above the invalidation level will violate the analysis
For risk management, please don't forget stop loss and capital management
When we reach the first target, save some profit and then change the stop to entry
Comment if you have any questions
Thank You

MTLUSDTHM signal v5.0 (High momentum) spotted. Looking good with previous wave up with increasing volume and momentum.
- Heathy retracement and support well at good level @ 1.2999-1.3569
- Trending slow and steady if able to hold above the support zone
It is at extremely good reward to risk level now if able to hold above the support level.


We have a descending trendline that MTL is attempting to breakThe trend of Metal is completely bearish, and it is moving straight downwards. We have a descending trendline that MTL is attempting to break, with buyers applying pressure.
The scenario involves breaking this trendline, if it breaks and retests, we could see an upward movement.

MTL - BuyFrom the specified range, it is possible to return the price to a higher side, and it is a holding for a few days, and the purchase will be in two steps.
#MTL
#MTLUSDT

just wanna ask hi whale please help me for pump mtl. because my money i all in to mtl. my money i wanna use in my wedding in 2024.
please help me whale.

Strong buying interest for MTLMTL is holding the support area at $1.33, indicating strong buying interest at this level. The price is attempting to bounce from this support, suggesting that buyers are stepping in to defend this area and potentially drive the price higher. This bounce attempt is crucial as it could signal the start of a new upward movement.
The key resistance area to watch is $1.54. This level acts as a barrier where selling pressure might emerge, potentially hindering further upward movement.

MTL TRENDING NEW LONGHi Traders,
I hope you all are doing well and navigating the crypto market with your best strategies.
This update is for MTLUSDT.
MTL is looking interesting over the next time frames and may show increased volume. That's why we're keeping an eye on this coin.
$2.00 is a key confirmation zone. If the coin breaks this level, there's a high chance it could reach $2.68
Remember, there are no guarantees in the market. Always follow a consistent system based on your own strategies and analysis.
Good times, everyone.
This update is not trading or financial advice.

#MTL/USDT#MTL
We have a bearish channel pattern on a 4-hour frame, the price moves within it, adheres to its limits well, and is expected to break it upwards in a strong manner.
We have a support area at the lower border of the channel at 1.50
We have a tendency to stabilize above moving average 100
We have a downtrend on the RSI indicator that supports the price higher
Entry price is 1.60
The first goal is 1.83
The second goal is 1.94
the third goal is 2.07
