MUBARAKUSDT Forming Bullish PennantMUBARAKUSDT is currently displaying a bullish pennant pattern, which is often seen as a continuation signal following a strong upward price movement. This setup typically indicates a brief consolidation phase before the price resumes its upward trend. With volume remaining consistent and interest from the trading community growing, this pennant formation may be preparing for a breakout that could lead to a substantial rally. Based on this pattern and the current market sentiment, a potential gain of 90% to 100%+ could be on the horizon.
Bullish pennants are powerful technical formations that attract traders looking for breakout momentum. MUBARAKUSDT’s consolidation within this pattern is healthy and controlled, which often precedes a breakout with strong follow-through. If the price action breaks above the upper trendline of the pennant with an increase in volume, it would confirm bullish strength and validate the expected move. The psychological support from the growing community around the project also strengthens the bullish case.
Investor interest is steadily building as the project continues to gain visibility in the meme and community-driven token space. The technicals align well with the narrative—low market cap, increasing trading volume, and a favorable chart setup all point toward an explosive breakout potential. This setup is being closely monitored by traders seeking high-risk, high-reward entries in altcoins with meme energy.
Keep an eye on key resistance levels and wait for confirmation on breakout candles before entering. MUBARAKUSDT might become one of the standout performers in the current meme token rotation, making it a promising opportunity in the short to mid-term.
✅ Show your support by hitting the like button and
✅ Leaving a comment below! (What is You opinion about this Coin)
Your feedback and engagement keep me inspired to share more insightful market analysis with you!
MUBARAKUSDT.P trade ideas

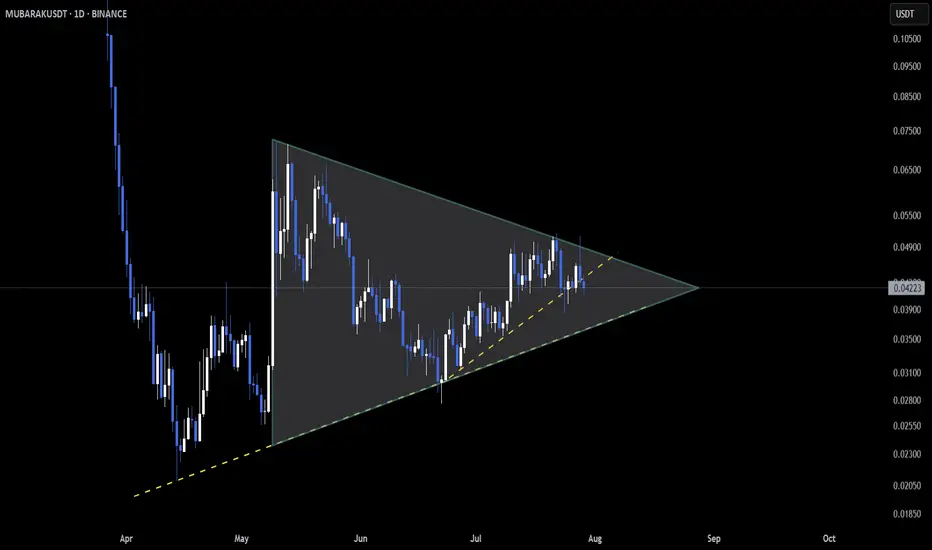
$MUBARAK – Symmetrical Triangle Compression on Daily Chart$MUBARAK continues to compress within a symmetrical triangle on the daily timeframe.
After rejecting from the upper trendline 🚫, price may revisit the mid-zone or trendline support.
Apex is approaching fast — volatility expansion expected soon 🔍
Breakout direction will set the tone for the next major leg.
Volume confirmation will be key to validating the move.
MUBARAKUSDT: Mid-Term Analysis🕌 MUBARAKUSDT Analysis
I think you can find a buyer from the blue box I’ve marked.
📍 Plan
If price comes into the blue box:
✅ Watch for footprint absorption (buyers holding the level)
✅ Look for CDV support or bullish divergence
✅ Wait for structure reclaim to confirm entry
⚡ Reminder
No chasing, no guessing.
If the setup aligns, take the trade with clear risk.
If not, let it go.
Stay patient. The right price, or no trade.
📌I keep my charts clean and simple because I believe clarity leads to better decisions.
📌My approach is built on years of experience and a solid track record. I don’t claim to know it all but I’m confident in my ability to spot high-probability setups.
📌If you would like to learn how to use the heatmap, cumulative volume delta and volume footprint techniques that I use below to determine very accurate demand regions, you can send me a private message. I help anyone who wants it completely free of charge.
🔑I have a long list of my proven technique below:
🎯 ZENUSDT.P: Patience & Profitability | %230 Reaction from the Sniper Entry
🐶 DOGEUSDT.P: Next Move
🎨 RENDERUSDT.P: Opportunity of the Month
💎 ETHUSDT.P: Where to Retrace
🟢 BNBUSDT.P: Potential Surge
📊 BTC Dominance: Reaction Zone
🌊 WAVESUSDT.P: Demand Zone Potential
🟣 UNIUSDT.P: Long-Term Trade
🔵 XRPUSDT.P: Entry Zones
🔗 LINKUSDT.P: Follow The River
📈 BTCUSDT.P: Two Key Demand Zones
🟩 POLUSDT: Bullish Momentum
🌟 PENDLEUSDT.P: Where Opportunity Meets Precision
🔥 BTCUSDT.P: Liquidation of Highly Leveraged Longs
🌊 SOLUSDT.P: SOL's Dip - Your Opportunity
🐸 1000PEPEUSDT.P: Prime Bounce Zone Unlocked
🚀 ETHUSDT.P: Set to Explode - Don't Miss This Game Changer
🤖 IQUSDT: Smart Plan
⚡️ PONDUSDT: A Trade Not Taken Is Better Than a Losing One
💼 STMXUSDT: 2 Buying Areas
🐢 TURBOUSDT: Buy Zones and Buyer Presence
🌍 ICPUSDT.P: Massive Upside Potential | Check the Trade Update For Seeing Results
🟠 IDEXUSDT: Spot Buy Area | %26 Profit if You Trade with MSB
📌 USUALUSDT: Buyers Are Active + %70 Profit in Total
🌟 FORTHUSDT: Sniper Entry +%26 Reaction
🐳 QKCUSDT: Sniper Entry +%57 Reaction
📊 BTC.D: Retest of Key Area Highly Likely
📊 XNOUSDT %80 Reaction with a Simple Blue Box!
📊 BELUSDT Amazing %120 Reaction!
📊 Simple Red Box, Extraordinary Results
📊 TIAUSDT | Still No Buyers—Maintaining a Bearish Outlook
📊 OGNUSDT | One of Today’s Highest Volume Gainers – +32.44%
📊 TRXUSDT - I Do My Thing Again
📊 FLOKIUSDT - +%100 From Blue Box!
📊 SFP/USDT - Perfect Entry %80 Profit!
📊 AAVEUSDT - WE DID IT AGAIN!
I stopped adding to the list because it's kinda tiring to add 5-10 charts in every move but you can check my profile and see that it goes on..

MUBARAK/USDT Ready to Explode? Final Compression Phase?
📊 Complete Technical Analysis – 12H Timeframe (BINANCE)
The MUBARAK/USDT pair is currently in a tight consolidation phase, forming a classic Symmetrical Triangle pattern. This structure indicates mounting pressure from both buyers and sellers, typically leading to a high-volatility breakout once the price escapes the triangle boundaries.
🔺 Pattern: Symmetrical Triangle – Sign of Impending Volatility
Rising Support Trendline (Higher Lows): Shows that buyers are gradually pushing price higher from each dip.
Descending Resistance Trendline (Lower Highs): Sellers are still active, but their strength is weakening over time.
Declining Volume: A healthy consolidation — decreasing volume is a hallmark of triangles before big moves.
Although neutral by nature, in this context, the bullish momentum seems stronger as price holds above key support.
🎯 Key Price Levels:
Price Level Description
0.04811 Breakout zone & first resistance
0.05381 Short-term target post-breakout
0.06000 Psychological resistance and reaction zone
0.06612 Maximum target based on triangle height projection
🟢 Bullish Scenario:
If price successfully breaks above the triangle’s resistance line and closes above 0.0481 USDT with strong volume:
Potential rally toward the 0.053 – 0.066 USDT range.
Triangle projection suggests a move of +50% or more from current levels.
Breakout confirmation: 12H candle close above 0.050 with above-average volume.
📌 Note: A post-breakout retest of the breakout line can offer a second entry opportunity if it holds as new support.
🔴 Bearish Scenario:
If the price breaks below the ascending support line:
Price may drop toward the demand zone between 0.034 – 0.030 USDT.
A deeper correction may target the previous low at 0.0208 USDT.
Watch for fakeouts — low-volume breakdowns may not hold.
🧠 Risk-Reward Strategy:
Aggressive Entry: On strong breakout above 0.048 with rising volume.
Conservative Entry: Wait for breakout confirmation + successful retest.
Stop Loss: Below 0.041 or just under the triangle's lower boundary.
Targets: TP1 at 0.053, TP2 at 0.060, TP3 at 0.066 (max range).
✅ Conclusion:
MUBARAK/USDT is at a critical juncture—a likely breakout from this symmetrical triangle could trigger a significant directional move. Traders should closely monitor volume spikes and candle closures for confirmation. This could be the beginning of a new trend phase for this asset.
#MUBARAKUSDT #CryptoBreakout #SymmetricalTriangle #AltcoinAnalysis #TechnicalSetup #TradingSignals #BullishSetup #BearishRisk #PriceAction

MUBARAKUSDT Forming Bullish WaveMUBARAKUSDT is starting to attract strong attention from traders and investors alike, thanks to its clear bullish wave pattern that suggests a significant upside move may be on the horizon. With good volume supporting this structure, the market is showing healthy participation, indicating that both retail and larger players are accumulating positions in anticipation of a breakout. The current setup points to a potential gain of 130% to 140%+, making it one of the more compelling opportunities in the crypto market right now.
The bullish wave pattern forming on the MUBARAKUSDT chart highlights a series of higher lows and strong impulsive moves, showing that buyers are firmly in control. This kind of technical formation often precedes large upward swings as it reflects steady accumulation and increasing confidence in the asset’s future price action. Investors watching this pair should pay close attention to breakout levels and volume confirmations to ride the next wave higher.
What sets MUBARAKUSDT apart is not just its technical setup but also the growing interest within the community and crypto trading groups. As momentum builds, more traders are likely to join the move, amplifying the buying pressure and potentially accelerating the uptrend. This aligns well with the broader sentiment in the altcoin space, where fresh capital is flowing into promising projects with strong chart structures.
For traders seeking a high-reward scenario with a well-defined pattern, MUBARAKUSDT stands out as a top pick. It’s wise to manage positions carefully and monitor the market for sustained breakouts above resistance levels. With solid fundamentals, increasing volume, and a bullish wave pattern backing it up, this pair could deliver one of the strongest performances in the coming weeks.
✅ Show your support by hitting the like button and
✅ Leaving a comment below! (What is You opinion about this Coin)
Your feedback and engagement keep me inspired to share more insightful market analysis with you!

MUBARAK Analysis (12H)Note: This is a risky and highly volatile meme coin.
It appears that the bullish X wave has ended at the point where we placed the red arrow on the chart, and the price has now entered a corrective phase once again. This correction seems to be forming a diagonal pattern, and we are currently in wave F of this structure.
If the price reaches the green zone, we can look for potential buy/long positions.
Targets are marked on the chart, with the main target being the flip zone.
A daily candle closing below the invalidation level would invalidate this view.
For risk management, please don't forget stop loss and capital management
Comment if you have any questions
Thank You

Mubarak Falling Wedge & Reversal Candle, Simple TradingAnother good chart setup, trade-opportunity, fully based on TA: MUBARAKUSDT.
The classic falling wedge is present on the chart, a perfect one.
The last candle that closed resulted in a reversal signal with increasing volume, also a higher low compared to April and May. Perfect market conditions. There is first a bottom pattern that leads to a bullish wave. The bullish wave gets corrected into a higher low and a clear reversal pattern develops. This higher low will lead to a new bullish wave where we are expected to sell at the top.
After this new bullish wave runs its course, we get a new correction. We know the end of this new correction because some form of signal will show up. We don't have to worry about the next correction nor about the long-term. Here, we can simply focus on the next target; buy now, wait and the market takes care of the rest.
Buy now when prices are low and hold. Set your sell (limit) order on target; the market takes care of the rest. Once your target hits, you will see a new balance in your account containing your initial layout plus profits. Very easy. Then rinse and repeat.
Next chart, next opportunity, next altcoin, next project, next pair, next trade.
Buy when prices are low; hold.
Sell when prices are high.
You can thank me now.
Namaste.

MUBARAKUSDT Forming Falling Wedge PatternMUBARAKUSDT is currently showcasing a classic falling wedge pattern, a widely recognized bullish reversal setup in technical analysis. After a period of steady decline within converging trendlines, the price appears to be approaching a breakout point. This pattern often signals a shift in market momentum, especially when supported by increasing volume — which is the case here. The current formation suggests a potential surge of 90% to 100%, offering a high-upside opportunity for early-positioned traders.
The volume profile remains favorable, indicating strong underlying investor interest. A falling wedge coupled with good volume often precedes powerful rallies as it demonstrates that sellers are losing steam while buyers are preparing to step in. MUBARAKUSDT is also gaining traction in online discussions and social sentiment, signaling that the broader market is beginning to pay attention to this emerging asset. This growing interest can serve as a catalyst for price acceleration once the breakout is confirmed.
Technically, a break above the upper resistance line of the wedge will be a key signal for bullish continuation. Traders should closely monitor breakout levels along with short-term resistance zones to manage entries. With proper confirmation, this trade setup has the potential to deliver one of the stronger moves among small-cap altcoins currently in consolidation phases.
Given the combination of chart structure, volume dynamics, and growing interest from crypto communities, MUBARAKUSDT is shaping up to be a coin to watch in the coming sessions. This setup is ideal for those seeking high-reward breakout trades based on technical strength.
✅ Show your support by hitting the like button and
✅ Leaving a comment below! (What is You opinion about this Coin)
Your feedback and engagement keep me inspired to share more insightful market analysis with you!

MUBARAK - Last Trades were BeautifulThis coins has really nice reactions to Fib and volume. Honestly this is one of my simplest coins. So nice reactions to fib and Vol
There is a really nice Short possibilities on those yellow marks. Lets see, what happens to volume if we reach there.
- There are very interesting confluences there. 2x Fib, FVG, avwap (pink), Blue TL, etc...
Maybe you find some confluences too and write it in comments :)
- The (?)-Level is tiny local pivot level. Bouncing or losing from it?
* its a local idea, which can be canceled within hours. Previous TAs of this coin were more daily and worked really nice.
Higher TF:
Follow for more ideas/Signals.💲
Check out my previous TA/Signals which played out nicely. :)
Just donate some of your profit to Animal rights or other charity :)✌️

$MUBARAKUSDT Long Trade Setup Setup 1h ChartLooks like price is respecting the ascending trendline well, showing strength at key support levels.
Here’s the plan:
- Entry Zone: $0.0580
- Stop Loss: $0.0548
- Targets:
• TP1: $0.0740
• TP2: $0.0883
As long as the price holds above the trendline, we may see a strong move toward the upside.
Break below SL invalidates this setup.
DYOR | Not financial advice.

Mubarak the meme coinMubarak is a meme coin on the BNB chain, historically meme coins on binance do a minimum of 500 million marketcap.
good choice, not financial advice!!

MUBARAK May Go Higher Than expected This chart illustrates the upside potential for Mubarak
Some coins did pullback today!
They may need to retest support
Bitcoin seems bullish
So altcoins could play ketchup
Mubarak can pump like Pengu did, could get volatile.

MUBARAK Roadmap (4H)The MUBARAK correction seems to have started from the point where I placed the red arrow on the chart.
The pattern could be a symmetrical, diametric, or expanding triangle. A strong demand zone lies ahead of the price, where we can look for buy/long positions.
Targets are marked on the chart.
A daily candle closing below the invalidation level will invalidate this analysis.
For risk management, please don't forget stop loss and capital management
When we reach the first target, save some profit and then change the stop to entry
Comment if you have any questions
Thank You

MUBARAKUSDT 4H AnalysisMUBARAK ~ 4H Analysis
#MUBARAK High Alert This trade carries a very high risk. Our analysis indicates this is a whale accumulation zone. Buy from here with a short-term target of at least 10%+.

MUBARAKUSDTWe can attempt to short MUBARAKUSDT from specified level as it make LH , also there is no bullish divergence occur indicate that it moves downward.

MUBARAK/USDT – Accumulation Ending? Double Bottom Signals Revers📊 Technical Overview: After a prolonged downtrend and descending wedge, MUBARAK has entered a consolidation range — clear signs of accumulation. The price has now bounced twice off the key support level at $0.003484, forming a textbook double bottom.
📈 Key Bullish Signals:
✅ Strong horizontal support holding at $0.003484
✅ Double bottom formation within the range
✅ Decreasing sell volume suggests sellers are drying up
✅ Break above $0.0400 range resistance could trigger rapid upside
📌 Bullish Target:
Short-term: $0.0500
Mid-term: $0.0700 (if momentum confirms breakout)
⚠️ Risk Management:
Breakdown below $0.00348 = invalidation
Consider tight stop-loss just below support
NEXT 30% TP IN MUBARAK/USDTFAST TRADE for 01/04/2025
ENTRY - 0.049
TP - 0.062
stop loss - 0.47 / 1H CLOSE

MUBARAK sell/short setup (2H)Given the bearish CH in lower timeframes and the formation of a supply zone, a downward move is expected.
There is a liquidity pool and an order block at the bottom of the chart, and candles are expected to move downward toward this area soon.
The closure of a 4-hour candle above the invalidation level will invalidate this setup.
Do not enter the position without capital management and stop setting
Comment if you have any questions
thank you

MUBARAKUSDT Hourly Technical AnalysisMUBARAKUSDT Hourly Technical Analysis
Mubarak Coin is currently in a recovery phase after being affected by Bitcoin’s decline. After forming support at 0.1288, it has reached the 0.1381 resistance level. At this level, it appears very close to the 21-day moving average. If it manages to stay above this average, the 0.1527 resistance level can be monitored. Indicators are currently in a positive state.
This meme coin is supported by CZ. It is currently being voted on for listing on the Binance exchange. While supporting this meme coin, CZ has been seen posting on his social media accounts wearing the traditional Arab attire featured in the coin’s symbol. In short, since there is a possibility that the MUBARAK coin may be listed on Binance in the future, the likelihood of positive price movements is high.
NOT FINANCIAL ADVICE
The information, comments, and recommendations provided here do not constitute investment advice. Investment advisory services are provided within the framework of an investment advisory agreement signed between clients and brokerage firms, portfolio management companies, or banks that do not accept deposits. The statements on this page reflect only personal opinions. These opinions may not be suitable for your financial situation, risk tolerance, or investment preferences. Therefore, no investment decisions should be made based on the information and statements on this page.
To avoid missing our analyses on positive or risky technical indicators, follow and like us—we would appreciate your support!

MUBARAKUSDT Hourly Technical AnalysisMUBARAKUSDT Hourly Technical Analysis
Mubarak Meme Coin has shown a positive breakout in the 1-hour technical analysis, breaking above the 0.13552 resistance level. Currently, it has broken above the 0.15057 resistance and surged up to 0.16595 resistance, increasing the risk of potential profit-taking sales. If profit-taking occurs, a pullback towards the 21-day price average (around 0.45057) may happen. Indicators are at peak levels, and slight downward movements in a partially negative direction can be observed.
Changpeng Zhao (CZ) still supports this coin. A vote is currently ongoing for its listing on Binance, and the results will be announced soon. This movement is creating a positive sentiment for now. If the listing vote results are positive, it could positively impact the price.
NOT INVESTMENT ADVICE.
The information, comments, and recommendations provided here do not constitute investment advice. Investment advisory services are offered within the framework of an agreement between clients and brokerage firms, portfolio management companies, and non-deposit banks. The content on this page reflects only personal opinions. These views may not be suitable for your financial situation, risk tolerance, or return preferences. Therefore, investments should not be made based on the information and writings on this page.
To avoid missing our analyses of both positive and risky technical indicators, follow us and like our content—we would appreciate it!

MUBARAK/USDTKey Level Zone: 0.1380 - 0.1420
HMT v7 detected. The setup looks promising, supported by a previous upward/downward trend with increasing volume and momentum, presenting an excellent reward-to-risk opportunity.
HMT (High Momentum Trending):
HMT is based on trend, momentum, volume, and market structure across multiple timeframes. It highlights setups with strong potential for upward movement and higher rewards.
Whenever I spot a signal for my own trading, I’ll share it. Please note that conducting a comprehensive analysis on a single timeframe chart can be quite challenging and sometimes confusing. I appreciate your understanding of the effort involved.
Important Note :
Role of Key Levels:
- These zones are critical for analyzing price trends. If the key level zone holds, the price may continue trending in the expected direction. However, momentum may increase or decrease based on subsequent patterns.
- Breakouts: If the key level zone breaks, it signals a stop-out. For reversal traders, this presents an opportunity to consider switching direction, as the price often retests these zones, which may act as strong support-turned-resistance (or vice versa).
My Trading Rules
Risk Management
- Maximum risk per trade: 2.5%.
- Leverage: 5x.
Exit Strategy
Profit-Taking:
- Sell at least 70% on the 3rd wave up (LTF Wave 5).
- Typically, sell 50% during a high-volume spike.
- Adjust stop-loss to breakeven once the trade achieves a 1.5:1 reward-to-risk ratio.
- If the market shows signs of losing momentum or divergence, ill will exit at breakeven.
The market is highly dynamic and constantly changing. HMT signals and target profit (TP) levels are based on the current price and movement, but market conditions can shift instantly, so it is crucial to remain adaptable and follow the market's movement.
If you find this signal/analysis meaningful, kindly like and share it.
Thank you for your support~
Sharing this with love!
HMT v2.0:
- Major update to the Momentum indicator
- Reduced false signals from inaccurate momentum detection
- New screener with improved accuracy and fewer signals
HMT v3.0:
- Added liquidity factor to enhance trend continuation
- Improved potential for momentum-based plays
- Increased winning probability by reducing entries during peaks
HMT v3.1:
- Enhanced entry confirmation for improved reward-to-risk ratios
HMT v4.0:
- Incorporated buying and selling pressure in lower timeframes to enhance the probability of trending moves while optimizing entry timing and scaling
HMT v4.1:
- Enhanced take-profit (TP) target by incorporating market structure analysis
HMT v5 :
Date: 23/01/2025
- Refined wave analysis for trending conditions
- Incorporated lower timeframe (LTF) momentum to strengthen trend reliability
- Re-aligned and re-balanced entry conditions for improved accuracy
HMT v6 :
Date : 15/02/2025
- Integrated strong accumulation activity into in-depth wave analysis
HMT v7 :
Date : 20/03/2025
- Refined wave analysis along with accumulation and market sentiment

MUBARAKUSDT Hourly Technical AnalysisMUBARAKUSDT Hourly Technical Analysis
In the 1-hour technical analysis of the newly listed Mubarak Meme Coin, it is moving at the same level as the 21-day price average. Indicators are positive, and the price is consolidating in a sideways range, fluctuating between 0.130 - 0.150.
This meme coin is supported by CZ and is currently undergoing a voting process on Binance. CZ has shown his support for this meme coin by wearing the traditional Arab outfit featured in the coin's symbol in his social media posts. In short, since MUBARAK coin has a potential chance of getting listed on Binance in the future, the probability of positive price movements is high.
THIS IS NOT INVESTMENT ADVICE.
The information, comments, and recommendations provided here do not constitute investment advice. Investment advisory services are offered within the framework of an investment advisory agreement signed between the investor and brokerage firms, portfolio management companies, or non-deposit banks. The content on this page reflects only personal opinions and may not be suitable for your financial situation, risk tolerance, or return expectations. Therefore, no investment decisions should be made based on the information and statements provided here.
To stay updated on our analyses with both positive and risky technical indicators, please follow and like our page. Your support is greatly appreciated!

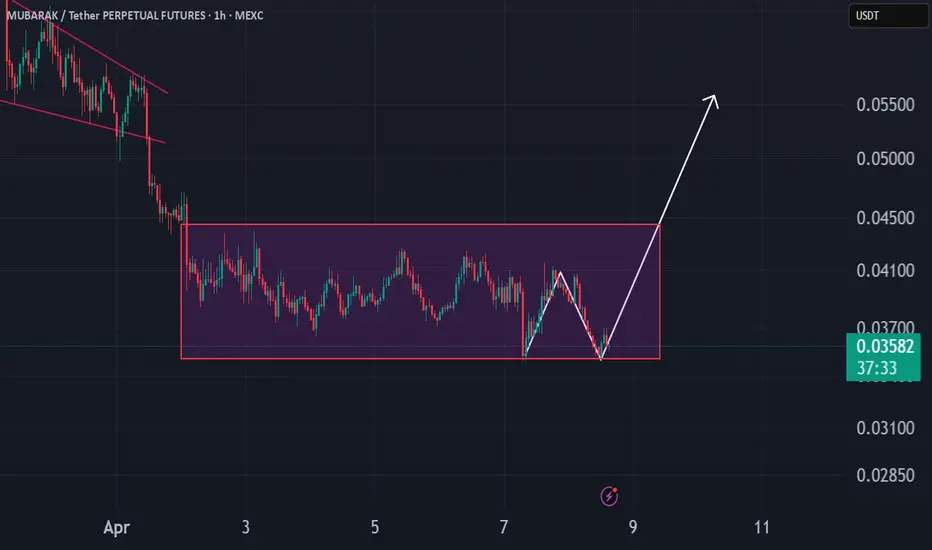
EID MUBARAK!! But its MUBARAK now!ALOT OF DMS for this!! Here is the chart, Green line happens if breaks the red box, but red line if the red box doesnt breaks!
