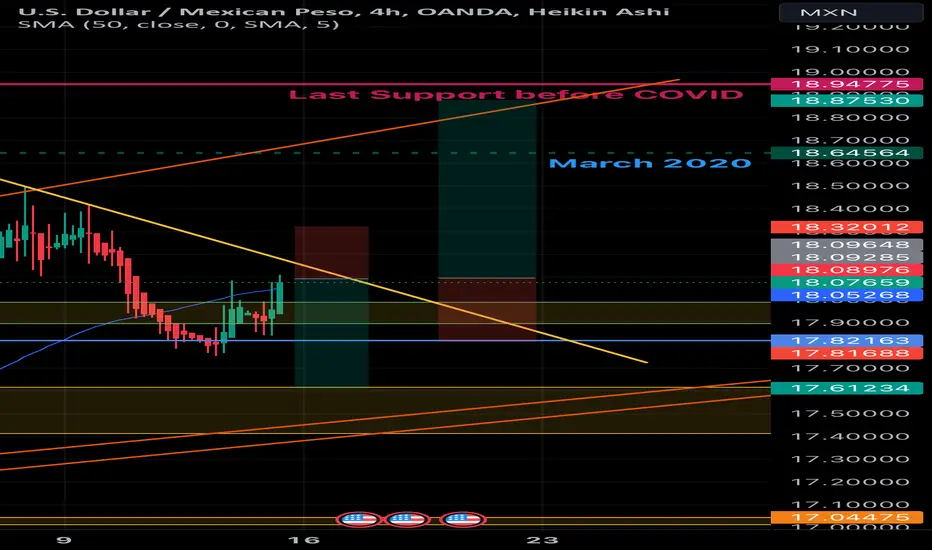
Looks like it wants to close under the trend line. Looks like we want to break the trend line. 1 hr candle looks like it wants to close on the other side. Could be a good scalp down. If it plays out and you missed it, there is always a retest where the candles closed below. You should have a 2nd opportunity there too.
Good luck out there. Hopefully in the next half hour, we should know if were staying up or down. Protect your bag, set your sl.
MXNUSD trade ideas

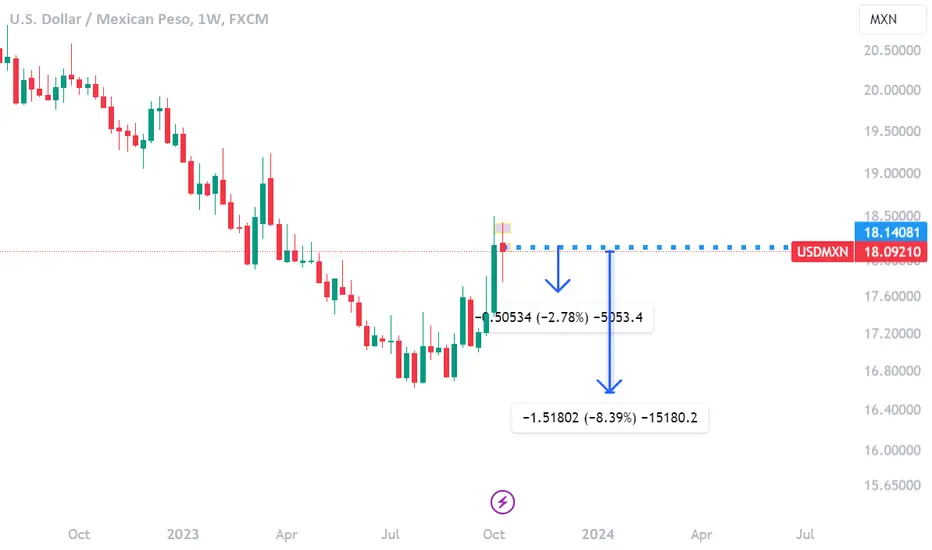
Oct 22th, 2023 - USDMXN to 17.77?Last week USDMXN traded between 17.85 and 18.46. Given Banxico's decision to maintain its benchmark policy rate at a record high of 11.25% at its September 2023 meeting, as widely expected, and FED's expectation to hike rates if the economy remains hot... Short term, (weekly) my bias is for dollar weakness. I am looking for dollar strength around the 105.917 DXY handle....
This move could possibly lead to MXN nearing the 17.77 handle for this week.
This is not financial advice by any means, I am not a licenced financial advisor and these are just my points of view of the market.
FX:USDMXN

USD and Mexican Peso Currency UpdateSee the cart and comments about the currency pair.
It could see some resistance here and trade back in between the wedge for some time still.
Eventually, it will break out of this wedge and establish the trading zone.

2 upcoming scalps. You can pick your favorite.2 ideas for this chart. If we close on the top side of the diagonal yellow line is a possible buy. If we don’t close we can take a sell. There will be a shake out so make sure you have stop loss active.
USDMXNUSDMXN price for SHORT opportunity. This setup just for intraday only. >> TAYOR
I'm just giving an idea, it's up to you to follow.
USD/MXN - Buy Idea 💡🎯The price of the dollar has fallen significantly until the beginning of August, showing a decline with considerable bullish strength.
- We hope that the price of the dollar reaches at least 19.5000.
- We have to wait at least for the price to fall since it has taken a target this week, we expect the price to fall back to the 17,000 -17,300 area

Mexican inflation is dropping but not fast enoughToday we saw the Mexican inflation come out lower than expected but it is not where the Mexican central bank wants it to be yet. For that reason, the work to slow inflation down is not done yet and they will have to at least keep the rates high... On the technical side, we see price failing to create a new higher high and we just broke below the structure for a potential short term bearish movement.

Neutral $MXNMXN is no longer a safe haven due to AMLO's upcoming departure and SheinPAN uncertainty. Neutral stance moving forward.

USDMXN Prime short position as it approaches a 2-year ResistanceThe USDMXN pair has been on a strong rise since July 28th, which was a Lower Low at the bottom of a 2-year Bearish Megaphone pattern. The rally has extended to a point where the price is about to test that 2-year top (Lower Highs) Resistance. The previous Lower High was priced exactly on the 0.786 Fibonacci retracement level and the new one is only a fraction away at 18.6900. We consider that current level already good enough to short, as the 1D RSI has also been on the overbought barrier (70.00) since October 03.
-------------------------------------------------------------------------------
** Please LIKE 👍, FOLLOW ✅, SHARE 🙌 and COMMENT ✍ if you enjoy this idea! Also share your ideas and charts in the comments section below! This is best way to keep it relevant, support us, keep the content here free and allow the idea to reach as many people as possible. **
-------------------------------------------------------------------------------
💸💸💸💸💸💸
👇 👇 👇 👇 👇 👇

USDMXN could resume the original uptrendSame reasoning as my previous ideas, this pair looks undervalued when looking at the USD fundamentals. We found a solid support and we are creating higher highs and higher lows...

USDMXN SWING BUYLooking for a simple buy this week and next week. Be patient with this trade. Market execute or await pullback to enter....Trade could possibly reach 17.55 but I'll be out at tp1. Enjoy!!!

USDMXN 02/04/2023Weekly:
-Inverse H&S pattern.
-Bullish M pattern.
-IC.
Daily:
-Bullish M pattern.
-IC.
-Next target is the daily imbalance.
4H:
-Inverse H&S pattern.
-IC.

USDMXN: TECHNICAL ANALYSIS.Hello traders,
Wave 4 has probably ended at 17.02968 zone. Wave 5 is supposed to materialise towards the
resistance zone at 17.70745-17.77245.
Thanks.

Going Short on UsdMxnPrice has tapped into liquidity, and returned back into the FVG.Looking at a decent sell to correct all the market inefficiencys

USDMX make divergenceUSDMX make divergence and break previous higher low i expect that it will go in bearish trend and it will hit my targets

Short in USDMXNToday, I opened a short position on the USDMXN due to the strong bearish trend in recent months. This trend has been driven by the attractiveness of Mexican bonds with their high interest rates. However, today's release of the CB Consumer Confidence (Aug) data in the United States was significantly lower than expected. The actual value was 106.1, while the forecast was 116 and the previous value was 110. This reinforces my belief that the bearish trend will continue, at least until reaching 16.65.
It is worth mentioning that my perspective may change if tomorrow's Core PCE data in the United States is higher than 3.9%. In that case, I will close the position as it would strengthen the dollar.
Remember that the financial market is volatile and subject to constant changes. It is always advisable to assess the data and adjust strategies accordingly.


USDMXNMy own view on USDMXN
This trading pair has been declined for many trading weeks with the strong in MXN (Long 80% of MXN by big financial institutions showed on CFTC data).
This week, the CFTC Data shows that Big Financial Institutions have closed Long Positions and Add more short Positions on MXN.
FED also prepares for raising more rate as inflation is still higher.
I expect this trading pair will be very bullish in these two trading weeks.
This is just my point of view not financial advice.

USDMXN SHORT IN PROGRESSLooks like the USDMXN is going short at the moment following a clear shooting- star candle with strong bearish closing candle, WATCH OUT!

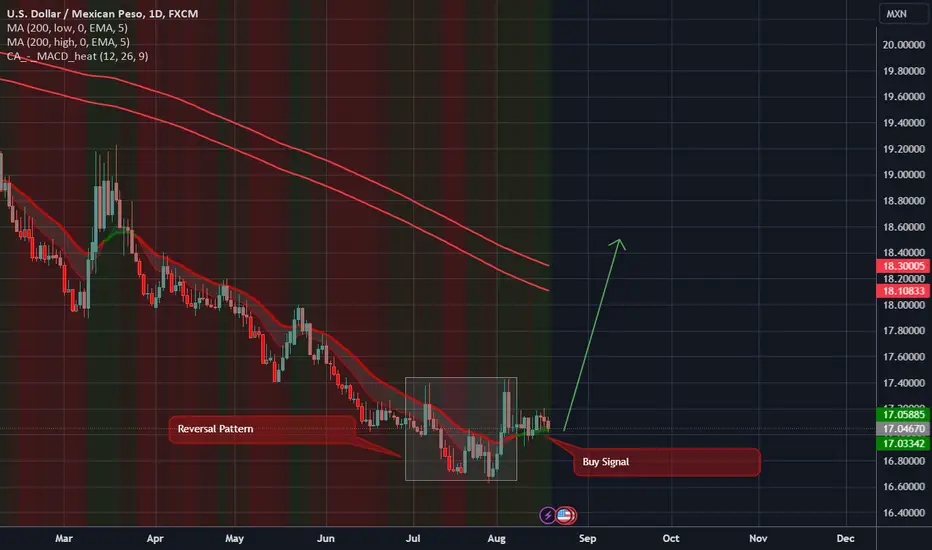
UsdMxn Buy Signal Usd/Mxn made a reversal pattern and it is complete on the daily time frame.
Now Usd/Mxn has a buy signal on the daily time frame.
I am buying Usd/Mxn and holding the trade for a little while..
I am always trading very small and using risk management.
USD/MXN is mamking bullish flagUSD/MXN is making bullish flag as there is no divergence at the chat .so it will countinue its bullish trend.


Divergence Example and how to confirm them with ADXI am sure, you have read and seen many example of divergence. However, it's easy to miss this formation. Unless you have MACD and you are checking constantly.
If you closely look at MACD formation, the Signal in Red has cut through the MACD line in Blue. Also, as the dotted yellow arrow shows, it is going up and making higher high.
On the chart, you can see that this pair is making Lower Lows. This discrepancy and difference between MACD and chart is called "Strong Bullish Divergence".
One way of confirmation on Divergence is using the ADX behavior. Blue line is ADX line and shows the strength of the direction of the chart, regardless Bullish or Bearish. It's like RMP in the cars. Just show the power of the move.
DI+ in Green shows the Bullish move which in this case has cut through the middle line in Gray Dotted,
AND
it has cut through Orange line of DI- which it means Bulls are in charge.
Conclusion is that there is a great chance of Bullish move for some time. It's hard to predict in this particular example, since Dollar is going down dramatically.
Divergence are not 100% all the time. However, I personally check them with ADX for additional confirmation.
Good luck traders.
