#MYRO/USDT myro road map ( 1 H )#MYRO
The price is moving within an ascending channel on the 1-hour frame, adhering well to it, and is poised to break it strongly upwards and retest it.
We have support from the lower boundary of the ascending channel, at 0.02040.
We have a downtrend on the RSI indicator that is about to break and retest, supporting the upward move.
There is a key support area in green at 0.02020, which represents a strong basis for the upward move.
Don't forget one simple thing: ease and capital.
When you reach the first target, save some money and then change your stop-loss order to an entry order.
For inquiries, please leave a comment.
We have a trend of stability above the Moving Average 100.
Entry price: 0.02040
First target: 0.02140
Second target: 0.02200
Third target: 0.002276
Don't forget one simple thing: ease and capital.
When you reach the first target, save some money and then change your stop-loss order to an entry order.
For inquiries, please leave a comment.
Thank you.
MYROUSDT trade ideas

#MYRO/USDT myro road map (HI)#MYRO
The price is moving within a descending channel on the 1-hour frame, adhering well to it, and is on its way to breaking it strongly upwards and retesting it.
We have a bounce from the lower boundary of the descending channel. This support is at 0.02400.
We have a downtrend on the RSI indicator that is about to break and retest, supporting the upside.
There is a key support area (in green) at 0.02350, which represents a strong basis for the upside.
Don't forget one simple thing: ease and capital.
When you reach the first target, save some money and then change your stop-loss order to an entry order.
For inquiries, please leave a comment.
We have a trend of stability above the Moving Average 100.
Entry price: 0.02476
First target: 0.02532
Second target: 0.02656
Third target: 0.02780
Don't forget one simple thing: ease and capital.
When you reach the first target, save some money and then change your stop-loss order to an entry order.
For inquiries, please leave a comment.
Thank you.

#MYRO/USDT myro road map (HI)#MYRO
The price is moving within a descending channel on the 1-hour frame, adhering well to it, and is on its way to breaking it strongly upwards and retesting it.
We have a bounce from the lower boundary of the descending channel. This support is at 0.02431.
We have a downtrend on the RSI indicator that is about to break and retest, supporting the upward move.
There is a key support area in green at 0.2038, which represents a strong basis for the upward move.
Don't forget one simple thing: ease and capital.
When you reach the first target, save some money and then change your stop-loss order to an entry order.
For inquiries, please leave a comment.
We have a trend of stability above the Moving Average 100.
Entry price: 0.02170
First target: 0.02215
Second target: 0.02316
Third target: 0.02431
Don't forget one simple thing: ease and capital.
When you reach the first target, save some money and then change your stop-loss order to an entry order.
For inquiries, please leave a comment.
Thank you.

MYROUSDT Breaks Out of Inverse Head and Shoulders BYBIT:MYROUSDT has a clear breakout from an Inverse Head and Shoulders pattern, signaling a potential bullish trend reversal. Price has decisively broken above the neckline around the $0.025 level, supported by increased volume. Additionally, MYRO price is trading above both the 100 EMA and 200 EMA, reinforcing the bullish momentum.
#MYRO/USDT myro road map ( 1 H )#MYRO
The price is moving within a descending channel on the 1-hour frame and is expected to break and continue upward.
We have a trend to stabilize above the 100 moving average once again.
We have a downtrend on the RSI indicator that supports the upward break.
We have a support area at the lower boundary of the channel at 0.02040, acting as a strong support from which the price can rebound.
We have a major support area in green that pushed the price upward at 0.01900.
Entry price: 0.02087
First target: 0.02178
Second target: 0.02278
Third target: 0.02373
To manage risk, don't forget stop loss and capital management.
When you reach the first target, save some profits and then change the stop order to an entry order.
For inquiries, please comment.
Thank you.

#MYRO/USDT. LONG?#MYRO
The price is moving within a descending channel on the 1-hour frame and is expected to break and continue upward.
We have a trend to stabilize above the 100 moving average once again.
We have a downtrend on the RSI indicator that supports the upward break.
We have a support area at the lower boundary of the channel at 0.016650, acting as a strong support from which the price can rebound.
We have a major support area in green that pushed the price upward at 0.01600.
Entry price: 0.01666
First target: 0.01750
Second target: 0.01837
Third target: 0.01955
To manage risk, don't forget stop loss and capital management.
When you reach the first target, save some profits and then change the stop order to an entry order.
For inquiries, please comment.
Thank you.

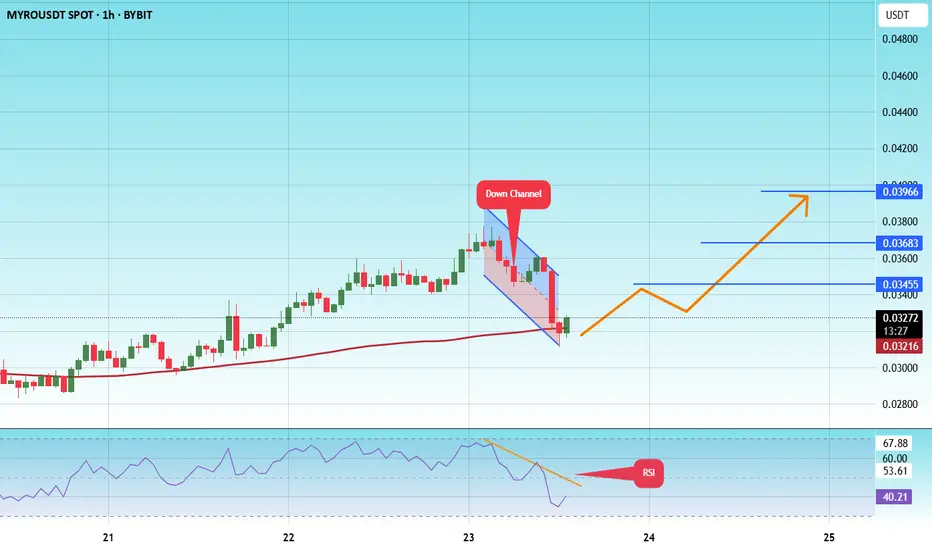
#MYRO/USDT#MYRO
The price is moving within a descending channel on the 1-hour frame, adhering well to it, and is on its way to breaking it strongly upwards and retesting it.
We are seeing a bounce from the lower boundary of the descending channel, this support at 0.0350.
We have a downtrend on the RSI indicator that is about to break and retest, supporting the upward trend.
We are looking for stability above the 100 Moving Average.
Entry price: 0.03739
First target: 0.03940
Second target: 0.04145
Third target: 0.04421

#MYRO/USDT#MYRO
The price is moving in a descending channel on the 1-hour frame and is adhering to it well and is heading to break it strongly upwards and retest it
We have a bounce from the lower limit of the descending channel, this support is at a price of 0.01562
We have a downtrend on the RSI indicator that is about to break and retest, which supports the rise
We have a trend to stabilize above the moving average 100
Entry price 0.01652
First target 0.01730
Second target 0.01784
Third target 0.01886

#MYRO/USDT#MYRO
The price is moving in a descending channel on the 1-hour frame and is adhering to it well and is heading to break it strongly upwards and retest it
We have a bounce from the lower limit of the descending channel, this support is at a price of 0.0190
We have a downtrend on the RSI indicator that is about to break and retest, which supports the rise
We have a trend to stabilize above the moving average 100
Entry price 0.0214
First target 0.0227
Second target 0.0243
Third target 0.0256

#MYRO/USDT Financial covenant#MYRO
The price is moving in a descending channel on the 1-hour frame and is adhering to it well and is heading to break it upwards strongly
We have a bounce from the lower limit of the descending channel, this support is at a price of 0.00250
We have a downtrend on the RSI indicator that is about to be broken, which supports the rise
We have a trend to stabilize above the moving average 100
Entry price 0.0258
First target 0.0283
Second target 0.0309
Third target 0.0340

#MYRO/USDT#MYRO
The price is moving in a descending channel on the 1-hour frame and is expected to continue upwards
We have a trend to stabilize above the moving average 100 again
We have a descending trend on the RSI indicator that supports the rise by breaking it upwards
We have a support area at the lower limit of the channel at a price of 0.0307
Entry price 0.0330
First target 0.0340
Second target 0.0356
Third target 0.0374

#MYRO/USDT myro road map (Daily)#MYRO
The price is moving within a descending channel on the 1-hour frame, adhering well to it, and is poised to break it strongly upwards and retest it.
We have a bounce from the lower boundary of the descending channel. This support is at 0.01679.
We have a downtrend on the RSI indicator that is about to break and retest, supporting the upward move.
There is a key support area in green at 0.01592, which represents a strong basis for the upward move.
Don't forget one simple thing: ease and capital.
When you reach the first target, save some money and then change your stop-loss order to an entry order.
For inquiries, please leave a comment.
We have a trend of stability above the Moving Average 100.
Entry price: 0.01708
First target: 0.01712
Second target: 0.01830
Third target: 0.01945
Don't forget one simple thing: ease and capital.
When you reach the first target, save some money and then change your stop-loss order to an entry order.
For inquiries, please leave a comment.
Thank you.

#MYRO/USDT#MYRO
The price is moving within a descending channel on the 1-hour frame and is expected to break and continue upward.
We have a trend to stabilize above the 100 moving average once again.
We have a downtrend on the RSI indicator, which supports the upward move by breaking it upward.
We have a support area at the lower limit of the channel at 0.001426, acting as strong support from which the price can rebound.
Entry price: 0.01588
First target: 0.01694
Second target: 0.01800
Third target: 0.01910

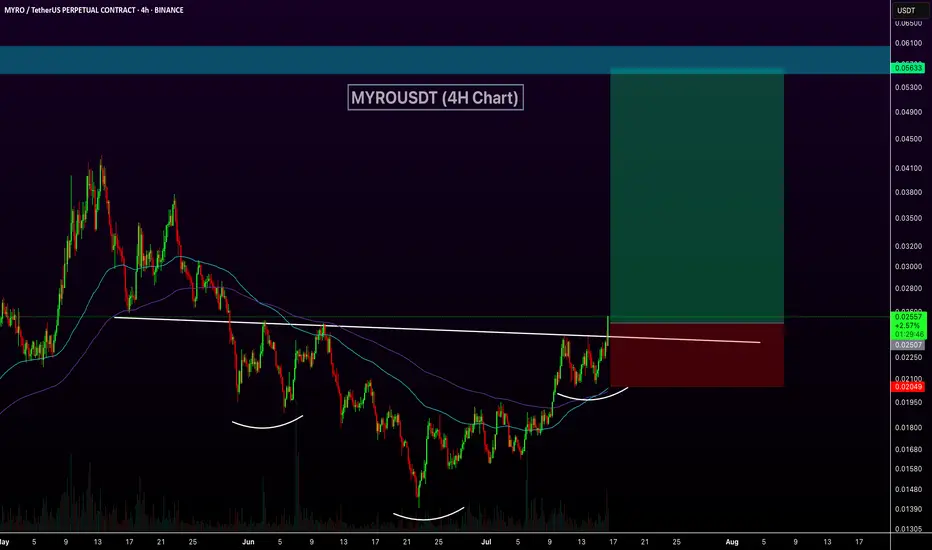
MYROUSDT 2D AnalysisMYRO ~ 2D Analysis
#MYRO Buy back on retest of this support block with short term target of at least 20%+ from this support.

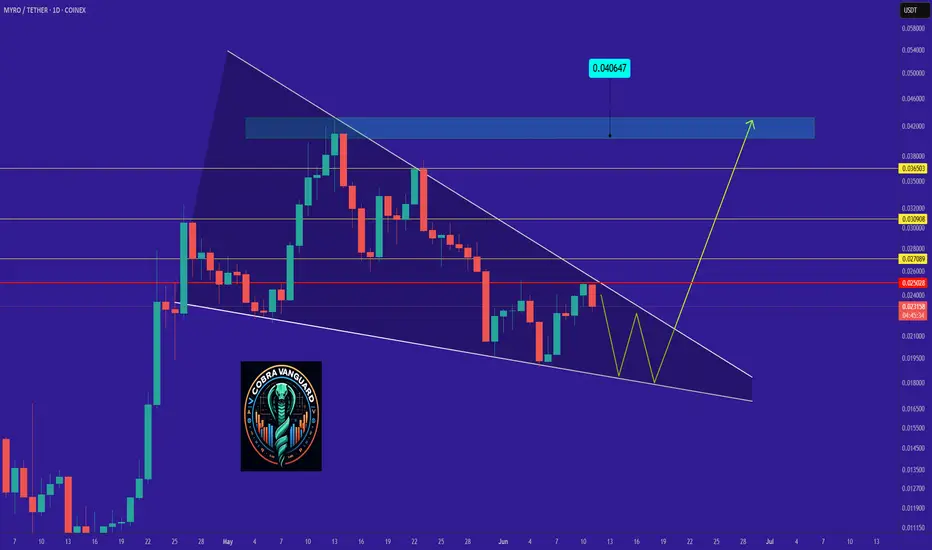
myro road map (Daily)The MYROUSDT chart shows a falling wedge pattern, approaching a resistance level at 0.025. A breakout above this level could confirm the next bullish target, but watch out for a potential reversal!
Best regards CobraVanguard.💚
#MYRO/USDT#MYRO
The price is moving within a descending channel on the 1-hour frame, adhering well to it, and is heading towards a strong breakout and retest.
We are experiencing a rebound from the lower boundary of the descending channel. This support is at 0.02333.
We are experiencing a downtrend on the RSI indicator, which is about to break and retest, supporting the upward trend.
We are heading towards stability above the 100 Moving Average.
Entry price: 0.02387
First target: 0.02434
Second target: 0.02475
Third target: 0.02536

MYROUSDT 3D AnalysisMYRO ~ 3D Analysis
#MYRO This trade is very high risk
Buy gradually from here with a short term target of at least 15%+, long term target $0.2 - $0.4

MYRO/USDTKey Level Zone: 0.02190 - 0.02210
LMT v1.0 detected.
The setup looks promising—price previously trended upward with rising volume and momentum, then retested this zone cleanly. This presents an excellent reward-to-risk opportunity if momentum continues to align.
Introducing LMT (Levels & Momentum Trading)
- Over the past 3 years, I’ve refined my approach to focus more sharply on the single most important element in any trade: the KEY LEVEL.
- While HMT (High Momentum Trading) served me well—combining trend, momentum, volume, and structure across multiple timeframes—I realized that consistently identifying and respecting these critical price zones is what truly separates good trades from great ones.
- That insight led to the evolution of HMT into LMT – Levels & Momentum Trading.
Why the Change? (From HMT to LMT)
Switching from High Momentum Trading (HMT) to Levels & Momentum Trading (LMT) improves precision, risk control, and confidence by:
- Clearer Entries & Stops: Defined key levels make it easier to plan entries, stop-losses, and position sizing—no more guesswork.
- Better Signal Quality: Momentum is now always checked against a support or resistance zone—if it aligns, it's a stronger setup.
- Improved Reward-to-Risk: All trades are anchored to key levels, making it easier to calculate and manage risk effectively.
- Stronger Confidence: With clear invalidation points beyond key levels, it's easier to trust the plan and stay disciplined—even in tough markets.
Whenever I share a signal, it’s because:
- A high‐probability key level has been identified on a higher timeframe.
- Lower‐timeframe momentum, market structure and volume suggest continuation or reversal is imminent.
- The reward‐to‐risk (based on that key level) meets my criteria for a disciplined entry.
***Please note that conducting a comprehensive analysis on a single timeframe chart can be quite challenging and sometimes confusing. I appreciate your understanding of the effort involved.
Important Note: The Role of Key Levels
- Holding a key level zone: If price respects the key level zone, momentum often carries the trend in the expected direction. That’s when we look to enter, with stop-loss placed just beyond the zone with some buffer.
- Breaking a key level zone: A definitive break signals a potential stop‐out for trend traders. For reversal traders, it’s a cue to consider switching direction—price often retests broken zones as new support or resistance.
My Trading Rules (Unchanged)
Risk Management
- Maximum risk per trade: 2.5%
- Leverage: 5x
Exit Strategy / Profit Taking
- Sell at least 70% on the 3rd wave up (LTF Wave 5).
- Typically sell 50% during a high‐volume spike.
- Move stop‐loss to breakeven once the trade achieves a 1.5:1 R:R.
- Exit at breakeven if momentum fades or divergence appears.
The market is highly dynamic and constantly changing. LMT signals and target profit (TP) levels are based on the current price and movement, but market conditions can shift instantly, so it is crucial to remain adaptable and follow the market's movement.
If you find this signal/analysis meaningful, kindly like and share it.
Thank you for your support~
Sharing this with love!
From HMT to LMT: A Brief Version History
HM Signal :
Date: 17/08/2023
- Early concept identifying high momentum pullbacks within strong uptrends
- Triggered after a prior wave up with rising volume and momentum
- Focused on healthy retracements into support for optimal reward-to-risk setups
HMT v1.0:
Date: 18/10/2024
- Initial release of the High Momentum Trading framework
- Combined multi-timeframe trend, volume, and momentum analysis.
- Focused on identifying strong trending moves high momentum
HMT v2.0:
Date: 17/12/2024
- Major update to the Momentum indicator
- Reduced false signals from inaccurate momentum detection
- New screener with improved accuracy and fewer signals
HMT v3.0:
Date: 23/12/2024
- Added liquidity factor to enhance trend continuation
- Improved potential for momentum-based plays
- Increased winning probability by reducing entries during peaks
HMT v3.1:
Date: 31/12/2024
- Enhanced entry confirmation for improved reward-to-risk ratios
HMT v4.0:
Date: 05/01/2025
- Incorporated buying and selling pressure in lower timeframes to enhance the probability of trending moves while optimizing entry timing and scaling
HMT v4.1:
Date: 06/01/2025
- Enhanced take-profit (TP) target by incorporating market structure analysis
HMT v5 :
Date: 23/01/2025
- Refined wave analysis for trending conditions
- Incorporated lower timeframe (LTF) momentum to strengthen trend reliability
- Re-aligned and re-balanced entry conditions for improved accuracy
HMT v6 :
Date : 15/02/2025
- Integrated strong accumulation activity into in-depth wave analysis
HMT v7 :
Date : 20/03/2025
- Refined wave analysis along with accumulation and market sentiment
HMT v8 :
Date : 16/04/2025
- Fully restructured strategy logic
HMT v8.1 :
Date : 18/04/2025
- Refined Take Profit (TP) logic to be more conservative for improved win consistency
LMT v1.0 :
Date : 06/06/2025
- Rebranded to emphasize key levels + momentum as the core framework

#MYRO/USDT#MYRO
The price is moving within a descending channel on the 1-hour frame, adhering well to it, and is heading for a strong breakout and retest.
We are seeing a bounce from the lower boundary of the descending channel. This support is at 0.02700.
We have a downtrend on the RSI indicator that is about to be broken and retested, supporting the upward trend.
We are looking for stability above the 100 moving average.
Entry price: 0.02750
First target: 0.02888
Second target: 0.03017
Third target: 0.03187

#MYRO/USDT#MYRO
The price is moving within a descending channel on the 1-hour frame and is expected to break and continue upward.
We have a trend to stabilize above the 100 moving average once again.
We have a downtrend on the RSI indicator, which supports the upward move by breaking it upward.
We have a support area at the lower limit of the channel at 0.03110, acting as strong support from which the price can rebound.
Entry price: 0.03280
First target: 0.03455
Second target: 0.03683
Third target: 0.03966
A bullish pattern was formed...Hello friends
Given the entry of buyers and the formation of an ascending pattern, you can enter into a transaction with capital and risk management and move towards the specified goals.
*Trade safely with us*

#MYRO/USDT#MYRO
The price is moving within a descending channel on the 1-hour frame, adhering well to it, and is on its way to breaking it strongly upwards and retesting it.
We are seeing a bounce from the lower boundary of the descending channel, this support at 0.02200.
We have a downtrend on the RSI indicator that is about to break and retest, supporting the upward trend.
We are looking for stability above the 100 Moving Average.
Entry price: 0.02368
First target: 0.02450
Second target: 0.02630
Third target: 0.02800

#MYRO/USDT#MYRO
The price is moving in a descending channel on the 1-hour frame and is adhering to it well and is heading to break it strongly upwards and retest it
We have a bounce from the lower limit of the descending channel, this support is at a price of 0.01670
We have a downtrend on the RSI indicator that is about to break and retest, which supports the rise
We have a trend to stabilize above the moving average 100
Entry price 0.01920
First target 0.02133
Second target 0.02133
Third target 0.02267
