ACO buy signal based on MRV1 setup on 5 Jan 24 at RM0.235
This is actually a repeated signal which was observed on 19 De 23 at the same price based on MRV1 setup.
Support area could be established at equilibrium support area of RM0.210 which is also the suggested stop loss to maintain minimum risk of 10%.
Stop loss aligns with next support area based on equilibrium.
Target price set at RM0.280 with a 1:2 risk/reward ratio or at RM 0.280 to align with equilibrium resistance price area. However, you may also adjust risk/reward ratio to 1:1.5 or 1:1.
Expected holding period is about 2-3 months as signal comes from daily chart.
Nearest resistance to break at RM0.245
Exercise extra caution as this is not a counter with good volume.
This information is for discussion purposes only and is not a buy/sell call.
ACO trade ideas

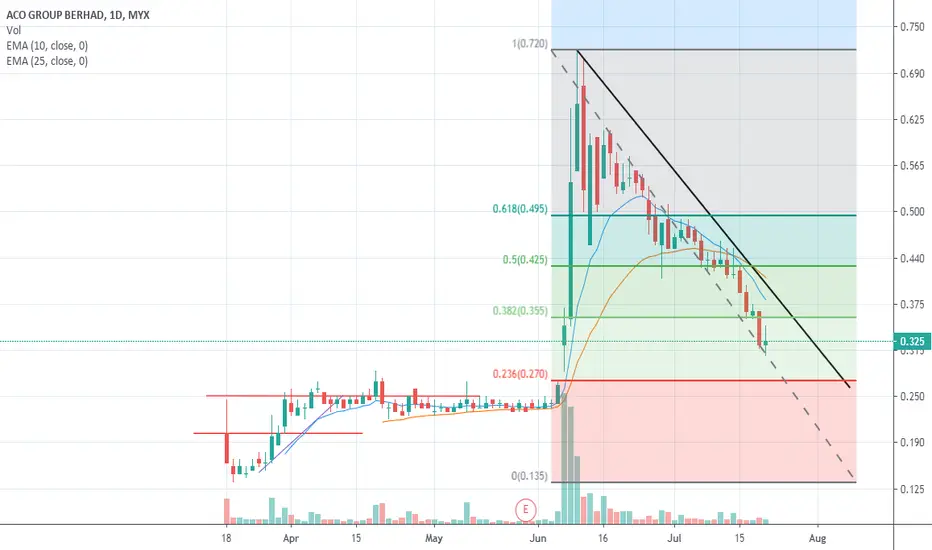
ACO GROUP BERHAD - Is It Time After Performing Double Bottom ?ACO seems to have exhausted the downtrend movement after the completion of their Private Placement Exercise, and performing double bottom. With a positive latest QR Result, ACO should be able to test the nearest Resistance at RM0.280 and continue up movement if break and sustained above this level.

ACO - Long at RBS (Portfolio)Tak ada orang ke tengok kaunter ACO ni. Naik 21%. Masuk kat RBS jer lepas breakout Kaw Kaw. :D

ACO - Resurface Out Trading Idea:
1) Wait for retracement and entry
2) Ride till TP set based on appetite
3) Set CL specified - nk folo taknak tepuk dada sendiri..
From the Chart:
1) Downtrend triangle - if break out technically possible to further more up.
2) HH formation observed
3) Last year momentum up and down. consolidation phase looks like going to end.
I am nubis, i am non-premium members ..follow if you think this idea make sense..just sit back, relax and make some money.
-Heil_Z-
# Are-snuff Traders Club
# Bilis Traders Group

ACO : break up MA200SMart money flow in
Note: For Interested to subscribe the VT MCDX Smart Money Pro and learn Victor Trade System, and kindly contact owner
(Disclaimer: for demonstrate own planned trade records study only and education purpose, not for recommend to buy or sell. Trade at your own risk)

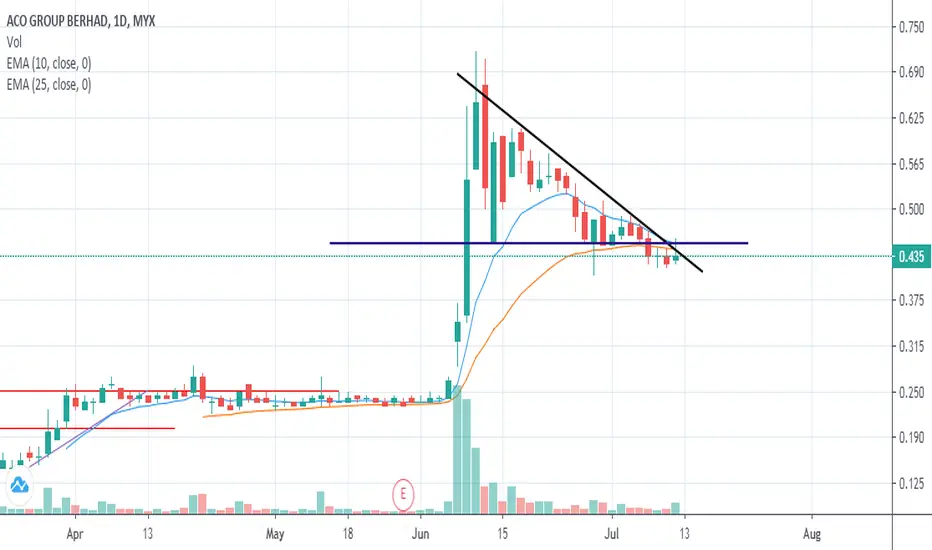
DOWNTRENDLINE BREAKOUT ACOPending downtrendline breakout:
Fundamental :
- new company
- in Industrial product and service sector
- recent Quarter report on 25th Aug,shows increasing QOQ (135%) and YOY (343%) - not shown in chart,can check at malaysiastockbiz website
- also owned by few big institutions
Technical :
- Pending breakout downtrendline and 200MA line.Have to monitor closely for valid breakout first before enter position
- Weekly MACD crossing up

ACO - Pre Consolidation BreakoutNO INVESTMENT ADVICE IS PROVIDED
DISCLAIMER
Please consider your own interpretation of Opportunity & Risk. The author of this post strictly follows the Malaysian Security Commission ( SC ) Guidelines on the prohibition of Investment Advice by unlicensed parties. Any examples shall use historical charts without any recommendations and not to cause inducement to the public to take action or position (e.g. buy, sell or hold) regarding a particular class, sector, or instrument in relation to securities or derivatives. The author will never provide any investment or trading advice as the activity of giving investment advice is likely to be considered as a regulated activity under the Capital Markets and Services Act 2007 ( CMSA ). All posts made in Tradingview do not include any communications involving providing recommendations or opinions or includes any material, content or any statement which are likely to induce a person to take any action or position (e.g. buy, sell or hold) regarding a particular class, sector, or instrument in relation to securities or derivatives that is likely to be considered as “advising others concerning securities or derivatives”. The author will not recklessly make any statement, promise or forecast that is misleading, false or deceptive to induce or attempt to induce another person to deal in securities or derivatives. None of information posted in post can be used as investment decisions. Do not trade solely on the information posted. Trade at your own risk and judgement. A trader could potentially lose all money. Only risk capital that can be lost without jeopardizing ones financial security of lifestyle. Please seek licensed professional guidance if you plan to invest your capital seriously.


ACO AnalysisTrend: Sideway
Accumulation price area: 0.370 to 0.400
-------------------------------Swing-------------------------------
Need to hold 2 weeks to 3 month
Entry price (low risk): 0.36 to 0.370
Stop loss: 0.345
TP1: 0.430
TP2: 0.460
TP3: 0.490
-------------------------------ShortTerm-------------------------------
Monitor the price and volume.
Entry when there are price breakout (or Bollinger band breakout) with high volume.
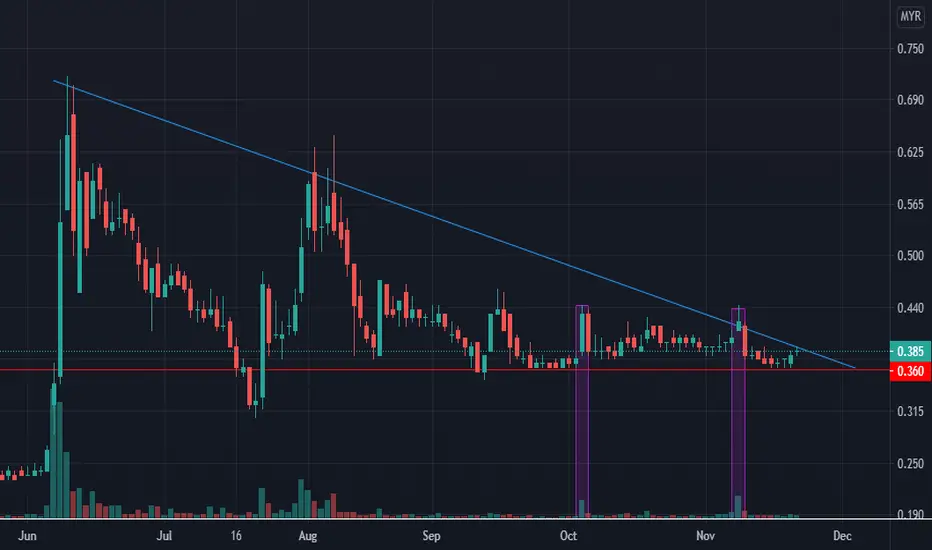


ACO (17/11/2020) on supportACO is ranging between 0.36 and 0.450 for 3 months and currently on bottom of of the parallel channel. Stochastic has reached oversold area and is trying to make an upside move. No sign of breakout from MACD.
With support zone @ 0.32, and resistance at 0.46, the RRR is abount 1:1.6.
The volume still lacks banker chip which explains the sideway movement.
EP 0.37
SL 0.32
TP 0.450
RRR 1:1.6
TAYOR.

Going breakout soon?Here's my analysis in DTF.
Currently the chart is forming triangle pattern. and as we know, with triangle, we need to see the price action first until it showing the strength ( breakout with volume) either resistant or support.
In my opinion, the wave almost create to 5 wave and will break resistant soon as per map show.
MACD indicator still in low -ve but the rsi is oversold. This is the best time to enter and wait the price action to react with this pattern.
Tp if price success in break the resistant will be 0.830.
But to go till that higher, we will see another continuation till complete the price there.
TAYOR. If you have a nice or comment, don't hesitate comment below.
Your idea and knowledge will help us more in learning this market trend and movement.

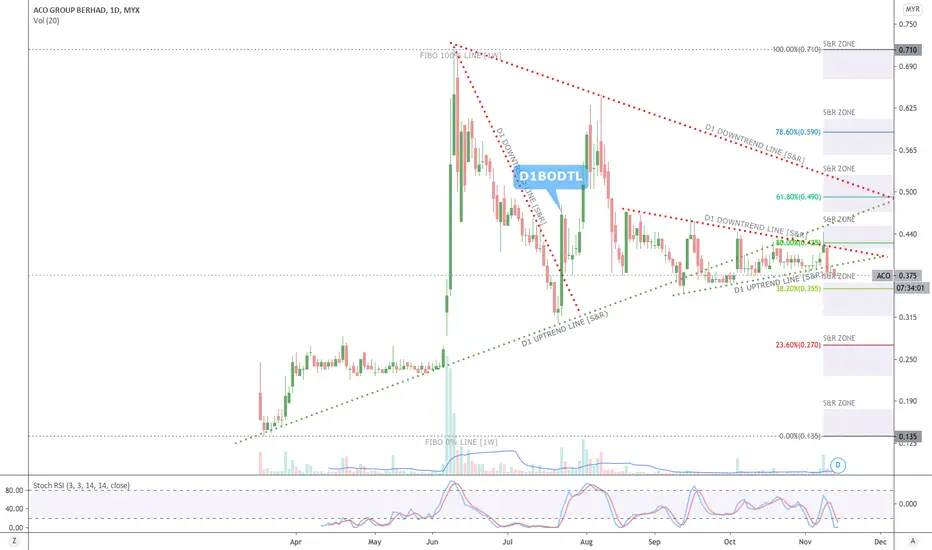
ACO [13 November 2020] Buy On Dip in Support ZoneMYX:ACO
SWING: 2 DAYS TO 2 WEEKS
Breakout Downtrend Line
52 Weeks High Line
Fibbonaci Retracement
Candlestick Support & Resistant Zone
Trendline Support & Resistant


ACO - Approaching 9-Bar Lowest Low - Act As Potential SupportOpportunity and Risk
DISCLAIMER: This technical analysis is for educational and informational purposes only. It is based on my personal view of the market from a technical standpoint. None of information posted in this page can be used as investment decisions except for educational purpose only. Do not trade solely on the information posted in this page. Trade at your own risk and judgement. A trader could potentially lose all money. Only risk capital that can be lost without jeopardizing ones financial security of lifestyle. Please seek licensed professional guidance if you plan to invest your capital seriously.
PENAFIAN: Analisis Teknikal ini hanyalah untuk tujuan pembelajaran & pendidikan sahaja dan bukan cadangan untuk membeli atau menjual stok atau apa jua jenis instrumen kewangan. Anda dinasihatkan untuk menghubungi remieser / dealer / bank pelaburan yang mempunyai lesen atau kelayakan yang sah untuk bertanyakan pendapat dan menguruskan pelaburan anda. Pelaburan dan perdagangan mempunyai risiko tinggi, dan ianya adalah Risiko Anda Sendiri.

ACO, I will wait for youTP1 0.285
TP2 0.270
Let's target it to go lower...sorry for those staying upside.
If you like my chart analysis, please like, follow me and share it to your friend. :)
Disclaimer: Every stock analysis are purely for educational/ informational support only. It is not for buy or sell call purpose. Everyone are responsible at your own trades.