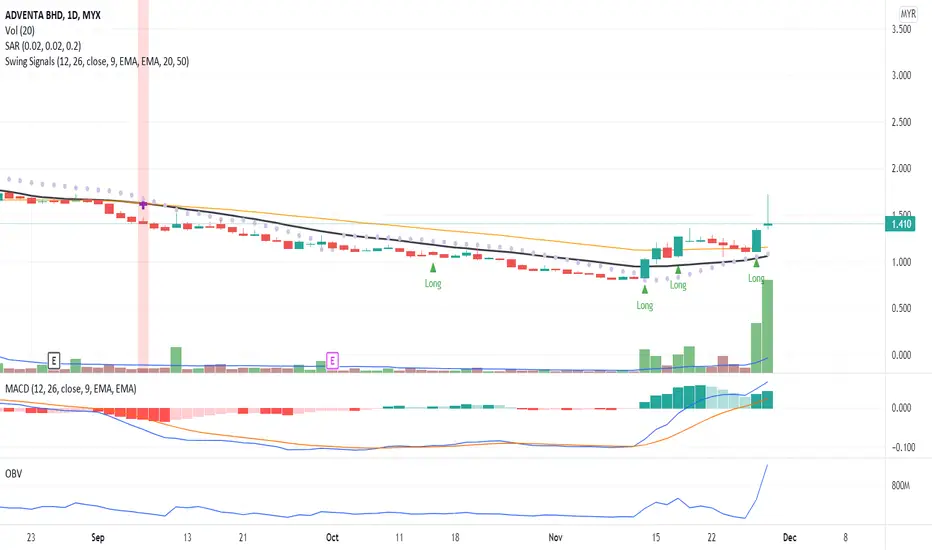
A Reversal Patterns!The candlestick formation pattern indicates the end of the existing downtrend pattern with RSI conforming to the candlestick pattern due to fresh buying on ADVENTA. Yet, the result in volume is not yet significant.
The MACD indicator indicates a reversal pattern towards the uptrend pattern.
Let's
0.005 MYR
2.19 M MYR
58.30 M MYR
157.86 M
About ADVENTA BHD
Sector
Industry
Website
Headquarters
Petaling Jaya
Founded
2004
ISIN
MYL7191OO009
FIGI
BBG000MPL620
Adventa Bhd. is an investment holding company, which engages in the provision of medical related products and services. It operates through the following segments: Healthcare Business, Warehousing Provider, and Corporate. The Healthcare Business segment consists of the supply of healthcare and related products and services to hospitals, healthcare centers and pharmacies. The Warehousing Provider segment focuses on the provision of industrial and commercial sterilization services, warehousing and handling services. The Corporate segment involves Group-level corporate services, treasury functions and provision of management services to subsidiaries. The company was founded by Chin Guan Low in 2004 and is headquartered in Petaling Jaya, Malaysia.
Related stocks

Adventa crossing 100MA downtrend.Using 100MA for 2hr chart and found it is in below the line. maybe can buy now sell tomorrow.

ADVENTA BHD AnalysisThis is an expect move of the ADVENTA BHD. Its is expected to move in bull side.

An Uptrend Pattern!OBV chart indicates a divergence signal where candlestick confirmed the uptrend pattern with volume above MA20.
There is a high probability of high demand in the Health Technology sector. Therefore, et put ADVENTA in WL and watch out for significant price movement with volume.
R 1.150
S 0.960
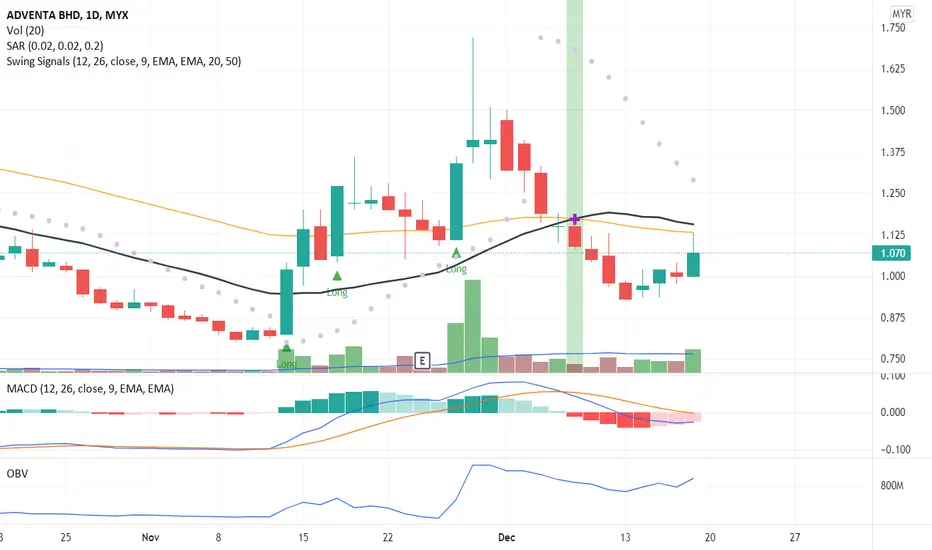
Strong Uptrend Pattern!ADVENTA continues with strong uptrend momentum where volume indicates buying interest in ADVENTA strength.
MACD and OBV charts confirmed the uptrend pattern. No sign of weak momentum.
To place a bid, use VWAP as a guideline and place your bid below the VWAP line.
Put ADVENTA in your WL and watch
A Breakout Signal!A price breakout when the candle has a full-body closed above MA20 with volume above MA20.
MACD and OBV charts indicate divergence signals
Watch out for a false breakout when the price returns to the previous trading range and fixes there. If the candle is full-bodied and closes below the MA20,

ADVENTA - Arrived SupportADVENTA
Rst: 2.26
Spp: 1.65
Resting at good supporting region now MA200 + MA50, downside potentially limited at current stage and you may expect technical rebound play from current zone. Retesting its descending trendline near 2.26 is possible.

ADVENTA - To See Sentimental PlayADVENTA
Rst: 2.36
Spp: MA200
Will see sentimental push back to descending trendline area, same thing, bearish stock the technical rebound will only be shortlived (last for few days).

ADVENTATEMA : HEALTCARE
case makin meninggkat, price mungkin cuba akan naik lagi. just ride selagi ada volume.
R1: 2.570
R2: 2.650
R3: 2.810
R4: 3.00
S1 : 2.490
S2 : 2410
S3: 2.330
S4: 2.250

ADVENTA - Beware of Climax VolumeADVENTA
Theme: Healthcare
Rst: 3.00
Spp: 2.36
Bullish breakout, but may be too good to be true in the view buying volume has climax, and green candle emerged today is relatively steep, shall observe weak candle tomorrow.

See all ideas
Summarizing what the indicators are suggesting.
Oscillators
Neutral
SellBuy
Strong sellStrong buy
Strong sellSellNeutralBuyStrong buy
Oscillators
Neutral
SellBuy
Strong sellStrong buy
Strong sellSellNeutralBuyStrong buy
Summary
Neutral
SellBuy
Strong sellStrong buy
Strong sellSellNeutralBuyStrong buy
Summary
Neutral
SellBuy
Strong sellStrong buy
Strong sellSellNeutralBuyStrong buy
Summary
Neutral
SellBuy
Strong sellStrong buy
Strong sellSellNeutralBuyStrong buy
Moving Averages
Neutral
SellBuy
Strong sellStrong buy
Strong sellSellNeutralBuyStrong buy
Moving Averages
Neutral
SellBuy
Strong sellStrong buy
Strong sellSellNeutralBuyStrong buy
Displays a symbol's price movements over previous years to identify recurring trends.
Frequently Asked Questions
The current price of ADVENTA is 0.190 MYR — it hasn't changed in the past 24 hours. Watch ADVENTA BHD stock price performance more closely on the chart.
Depending on the exchange, the stock ticker may vary. For instance, on MYX exchange ADVENTA BHD stocks are traded under the ticker ADVENTA.
ADVENTA stock has fallen by −2.56% compared to the previous week, the month change is a 5.56% rise, over the last year ADVENTA BHD has showed a −37.70% decrease.
ADVENTA reached its all-time high on Aug 5, 2020 with the price of 4.440 MYR, and its all-time low was 0.150 MYR and was reached on Jun 20, 2025. View more price dynamics on ADVENTA chart.
See other stocks reaching their highest and lowest prices.
See other stocks reaching their highest and lowest prices.
ADVENTA stock is 2.63% volatile and has beta coefficient of 1.21. Track ADVENTA BHD stock price on the chart and check out the list of the most volatile stocks — is ADVENTA BHD there?
Today ADVENTA BHD has the market capitalization of 58.06 M, it has decreased by −4.88% over the last week.
Yes, you can track ADVENTA BHD financials in yearly and quarterly reports right on TradingView.
ADVENTA net income for the last quarter is 313.00 K MYR, while the quarter before that showed 788.00 K MYR of net income which accounts for −60.28% change. Track more ADVENTA BHD financial stats to get the full picture.
EBITDA measures a company's operating performance, its growth signifies an improvement in the efficiency of a company. ADVENTA BHD EBITDA is 3.63 M MYR, and current EBITDA margin is 9.08%. See more stats in ADVENTA BHD financial statements.
Like other stocks, ADVENTA shares are traded on stock exchanges, e.g. Nasdaq, Nyse, Euronext, and the easiest way to buy them is through an online stock broker. To do this, you need to open an account and follow a broker's procedures, then start trading. You can trade ADVENTA BHD stock right from TradingView charts — choose your broker and connect to your account.
Investing in stocks requires a comprehensive research: you should carefully study all the available data, e.g. company's financials, related news, and its technical analysis. So ADVENTA BHD technincal analysis shows the sell today, and its 1 week rating is sell. Since market conditions are prone to changes, it's worth looking a bit further into the future — according to the 1 month rating ADVENTA BHD stock shows the sell signal. See more of ADVENTA BHD technicals for a more comprehensive analysis.
If you're still not sure, try looking for inspiration in our curated watchlists.
If you're still not sure, try looking for inspiration in our curated watchlists.