A Reversal Patterns!The candlestick formation pattern indicates the end of the existing downtrend pattern with RSI conforming to the candlestick pattern due to fresh buying on ADVENTA. Yet, the result in volume is not yet significant.
The MACD indicator indicates a reversal pattern towards the uptrend pattern.
Let's save ADVENTA in WL and watch out for significant price movement with the result in volume towards a new peak price.
R 0.500
S 0.400
ADVENTA trade ideas

Adventa crossing 100MA downtrend.Using 100MA for 2hr chart and found it is in below the line. maybe can buy now sell tomorrow.

ADVENTA BHD AnalysisThis is an expect move of the ADVENTA BHD. Its is expected to move in bull side.

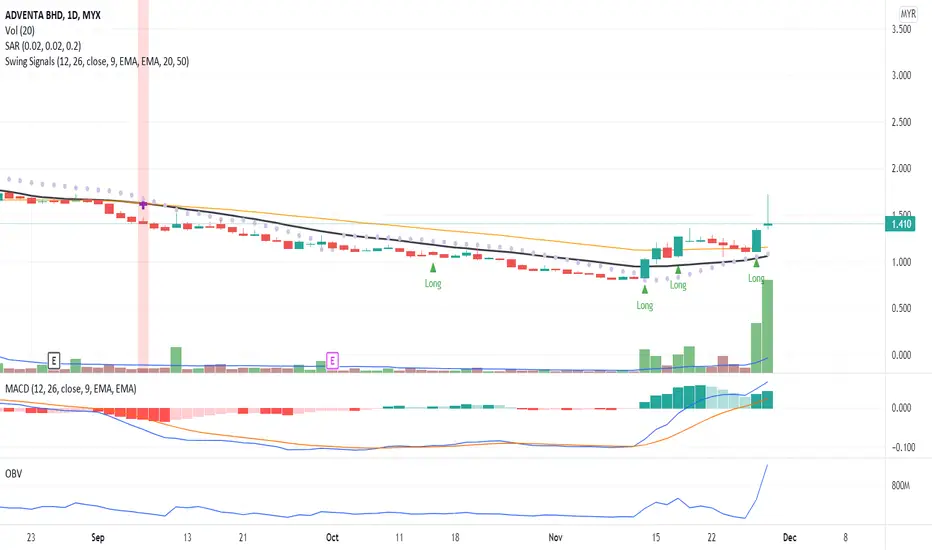
An Uptrend Pattern!OBV chart indicates a divergence signal where candlestick confirmed the uptrend pattern with volume above MA20.
There is a high probability of high demand in the Health Technology sector. Therefore, et put ADVENTA in WL and watch out for significant price movement with volume.
R 1.150
S 0.960
Strong Uptrend Pattern!ADVENTA continues with strong uptrend momentum where volume indicates buying interest in ADVENTA strength.
MACD and OBV charts confirmed the uptrend pattern. No sign of weak momentum.
To place a bid, use VWAP as a guideline and place your bid below the VWAP line.
Put ADVENTA in your WL and watch out for significant price movement or when MA20 crosses up MA50 hence indicating a strong uptrend momentum.
R 1.830
S 1.06
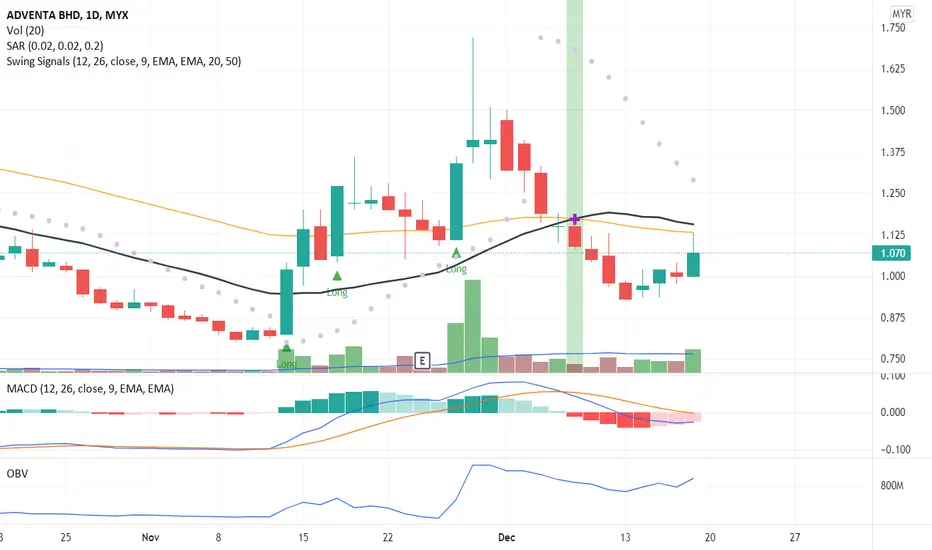
A Breakout Signal!A price breakout when the candle has a full-body closed above MA20 with volume above MA20.
MACD and OBV charts indicate divergence signals
Watch out for a false breakout when the price returns to the previous trading range and fixes there. If the candle is full-bodied and closes below the MA20, wait for yet another candle. This second confirmation candle should be smaller than the breakout candle and it should also close below the breakout level.
Put ADVENTA in your WL and watch out for significant price improvement with volume and when MA20 crosses up to MA50, hence indicating a long trade position.
R 1.14
S 0.955

ADVENTA - Arrived SupportADVENTA
Rst: 2.26
Spp: 1.65
Resting at good supporting region now MA200 + MA50, downside potentially limited at current stage and you may expect technical rebound play from current zone. Retesting its descending trendline near 2.26 is possible.

ADVENTA - To See Sentimental PlayADVENTA
Rst: 2.36
Spp: MA200
Will see sentimental push back to descending trendline area, same thing, bearish stock the technical rebound will only be shortlived (last for few days).

ADVENTATEMA : HEALTCARE
case makin meninggkat, price mungkin cuba akan naik lagi. just ride selagi ada volume.
R1: 2.570
R2: 2.650
R3: 2.810
R4: 3.00
S1 : 2.490
S2 : 2410
S3: 2.330
S4: 2.250

ADVENTA - Beware of Climax VolumeADVENTA
Theme: Healthcare
Rst: 3.00
Spp: 2.36
Bullish breakout, but may be too good to be true in the view buying volume has climax, and green candle emerged today is relatively steep, shall observe weak candle tomorrow.

ADVENTA Targer LongCurrently price seem like under compression phase (candle become smaller) . Can look for buying opportunities if price reject at support area either reversal candle , double bottom pattern or compression . To be save can wait price breakout the TL and retest back then entry. SL if break support area and TP at nearest resistant to be safe.


Adventa road map9/12/20
Bullish candle yesterday sign shorterm price going up
Price masih belum habis flush harga ke bawah.
Sebelum kenaikan harga ke atas

Adventa road map8/12/20
Tomorow will be strong bullish candle. Price naik shortern.
Adventa not finish flushing price. Price akan going down further

ADVENTA [20 October 2020] Buy On Dip in Support ZoneMYX:ADVENTA
SWING: 2 DAYS TO 2 WEEKS
Breakout Downtrend Line
52 Weeks High Line
Fibbonaci Retracement
Candlestick Support & Resistant Zone
Trendline Support & Resistant
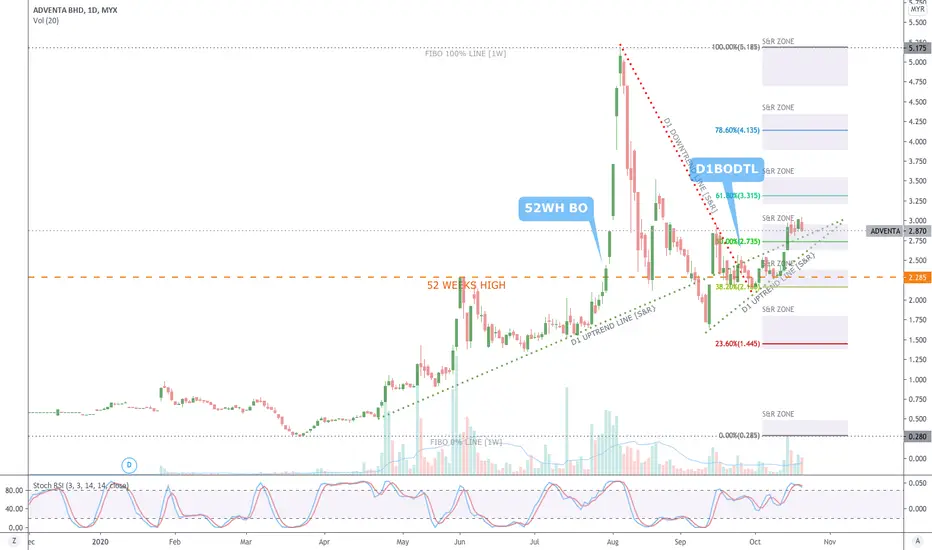
Breakout Down Trend Line (BODTL)1. Increase volume and strong movement price
2. Today hit nearest resistance.
3. Tomorrow will go up if break the resistance


Adventa breakout from cup and handle. target 3.201) Adventa is the last 2nd tier gloves that breakout from cup and handle. Profit target 3.20
2) MCDX+ is bullish.
3) 2nd tier gloves are bullish.

Training 30/7/2020 - ADVENTAAny input @ feedback for me to improves in drawing the chart and writing down my trading plan is really appreciated. Btw, be nice please.. Thank you and have a great trading

