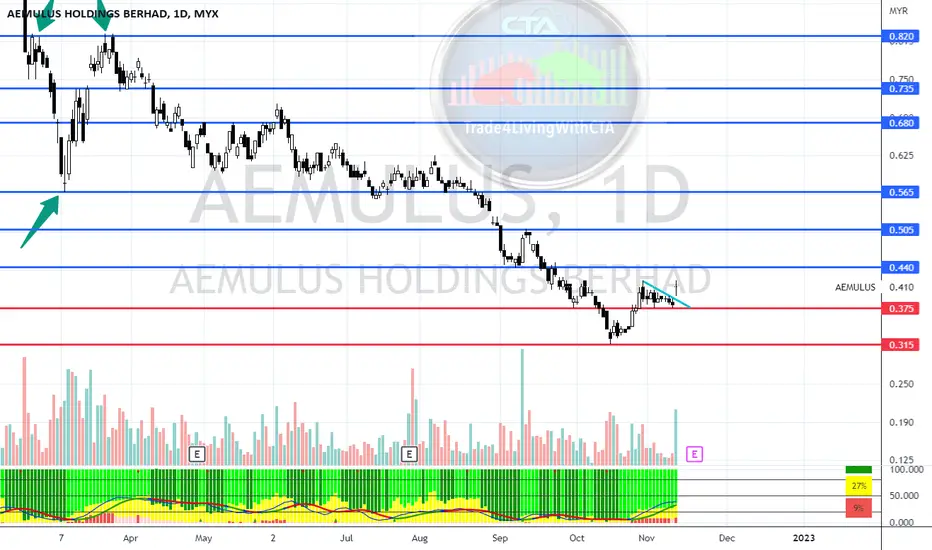
AEMULUS is retracinghow low it will retrace
this analysis is using a combination of gann and fibonacci retracement numbers
maybe from using this combination, we can also predict the time reversal will happen
AEMULUS trade ideas

AEMULUS create spring, currently only strong holder
1. **Accumulation and Distribution Phases**:
- There's a clear accumulation phase between November 2023 and February 2024, showing price consolidation at lower levels.
- A distribution phase appears from June to August 2024, with price making higher highs before reversing.
2. **Wyckoff Schematics**:
- The chart shows a "Spring" around March 2023 (when price broke below support then quickly reversed).
- Several "Tests" of resistance levels are visible, particularly around June-July 2024.
- The "Sign of Strength" rally is evident from February to May 2024.
3. **Volume Analysis**:
- Volume increased during the early 2024 uptrend (accumulation confirmation)
- The May 2024 peak showed high volume (distribution), followed by decreasing volume as price declined.
- Recent selling has occurred on increased volume (bearish confirmation).
4. **Price/Volume Relationships**:
- Price rises on increasing volume (bullish)
- Price drops on increasing volume (bearish)
- Several instances of "effort vs. result" divergence, where large volume (effort) produced minimal price movement (result).
5. **Current Positioning**:
- The stock appears to be in a re-accumulation or possibly continued distribution phase.
- The recent lower highs and lower lows suggest continued weakness.
- The multiple "Sell" signals on the chart align with Wyckoff's distribution concept.
The Fibonacci retracement levels (0.382, 0.5, 0.618) shown on the chart support the Wyckoff analysis, with price respecting these key levels during both advances and declines.

Aemulus' Technical Chart Breakout Above 0.405 ResistancePenang Semicon ATE player Aemulus' technical chart shows a breakout above its resistance at 0.405, along with bullish sentiment in the Bursa technology sector.

AEMULUS BREAKDOWN OR BREAKUPIf AEMULUS repeat it previous pattern, price will breakdown before going up back after touch the red line. Or it will breakup until blue line before going down. Just my 2-cent idea. Please comment if you have any idea. Thank you.

AEMULUS TECHNICAL ANALYSISTechnical analysis for AEMULUS Stock based on Trend Analysis, Chart Pattern and VPA

0181 Aemulus reboundWeekly chart got the TD 9 and Force 9 shows the downtrend could be exhaust in short term.
Daily chart shows the bottom divergence of energy, foresee a rebound in short term, still have a good opportunity at the current price.

Aemulus Simple Chart AnalysisFor KLSE tech, don't hope too much 1st cause there are still election on going. So just be conservative by trading a few tech will do.
420 area break will be indicate a good sign ahead here. Since 375 area looks supported, it can be use as support. I assume it will follow SOX movement for the time being. Red chip does appear recently but is not that wild yet.
Aemulus Simple Chart AnalysisOverall still on a downtrend momentum but this red chip does appear recently. So just monitor its retracement ended only to take action. Might hit 440 or above.

AEMULUS MAJOR CORRECTIVE STRUCTUREAemulus setup progression for wave B. maybe area 0.950. For major correction it will down to 0.400

Will Retrace to 0.786 @RM0.33This is my prediction for Aemulus. 100% wrong and if it goes right then its only coincidence. Only prediction.

AEMULUS IN CORRECTION CMy Prediction is it will complete C as show on the chart, now in wave 4 to wave 5 to complete C...this C may be fib 0.618(RM0.53-0.56)/0.786(RM0.33-0.34) AND it in wave 2 correction on a bigger cycle.

Aemulus....adakah tulus & ikhlasHidden Divergence
price HH
testing RBS
spring flush
-vol absorb
-earning play
-FA good

Aemulus Future DirectionAemulus has been consistently climbing the parallel channel. Latest QR report was good and price pulled back to support. Currently in a continuation pattern. Let see if it can continue its climb to challenge the All Time High price which is just about 8% from its current price.

A new trend possible to build after previous analysisPlan the set up and possible a new trend forming if unbreakable buyer force


AEMULUSuptrend counter
currently price break resistence area.
if can maintain above 1130, next stop is 1220 and 1285.
base on volume and EMA line, momentum to going up still strong
take ur own risk

AEMULUSlatest analysis for this counter
history repeat itself
jsut using chart pattern
maybe the same pattern will repeat for
another price target
can PLAN UR TRADE
personally, this counter in discount price
target 10% ROI is reasonable

AEMULUS just completed an Impulse WaveCorrection is under way from my view or forecast, what say you?

AEMULUSsecond trading idea for aemulus.
uptrend counter
already break DTL
if price maintain above trendline, high chances to reach net resistence
plan ur trade
trade as planned
TAYOR

repeating previous pattern?1. Price currently in Stage 2 Stan Weinstein analysis (price above MA200)
2. Currently price testing MA50
- try to validate the uptrend continuation
3. Current price movement (base) create almost the same pattern as previous base
- (1) testing resistance and temporary breakout
- (2) fake breakout
- (3) another test on resistance before genuine breakout occur
Summary: interesting to look on if
- price make multiple test on resistance before rebound on MA50 and breakout
or
- price directly breakout resistance level
Disclaimer:
This technical analysis idea is only for the purpose of study and personal analysis only. Any buy or sell actions taken should be based on your own analysis. Trade at your own risk.

AEMULUS Trendline support and resistanceUsing trendline and stochastic to identify best entry and take profit area.
Disclaimer: This is for educational purpose only, not a buy call.

Aemulus breakoutBreakout its previous resistance 1.040 with obvious candle movement and healthy volume

<TradeVSA> Continuation of Trend in AemulusSign of Strength in the chart:
1. Uptrend with re-accumulation
2. Green Pentagon with increasing volume
3. Cluster of Closes near Support
Disclaimer
This information only serves as reference information and does not constitute a buy or sell call. Conduct your own research and assessment before deciding to buy or sell any stock
