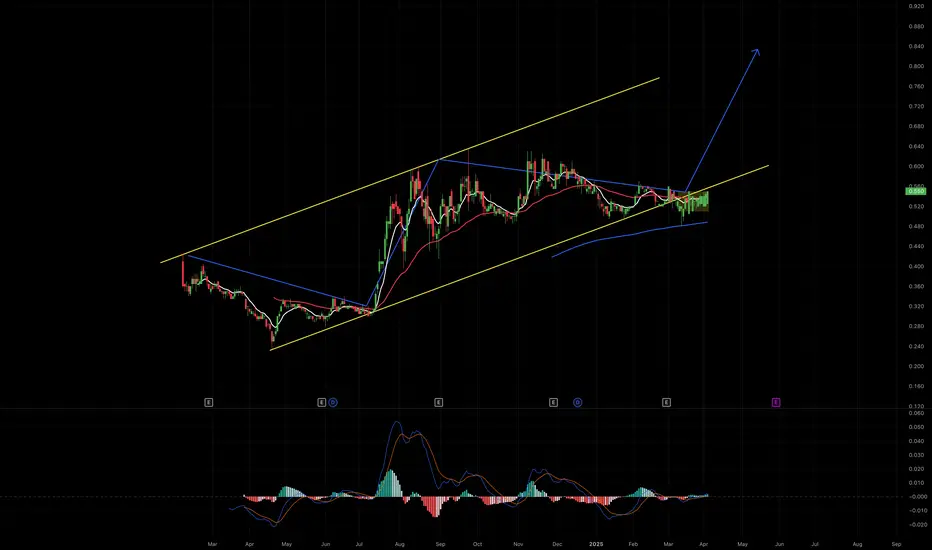
AGX - Bullish Wedge Bullish Wedge CP Pattern on the Daily Timeframe (Daily TF)
The Bullish Wedge CP (Continuation Pattern) is a technical chart pattern that signals a potential uptrend continuation after a period of consolidation. On the daily timeframe, this pattern can provide strong signals for medium to long-term entries.
Characteristics of the Bullish Wedge CP Pattern:
Previous Trend is Uptrend:
This pattern appears after a strong upward price movement.
Price Moves in a Contracting Formation:
Price forms a narrowing wedge — with lower highs and lower lows that converge over time.
Declining Volume:
During the wedge formation, volume usually decreases, indicating a market pause or rest.
Breakout to the Upside:
Once the price breaks the resistance of the wedge with increasing volume, it signals a strong bullish continuation.
Continuation Pattern Confirmation:
After the breakout, the price typically retests the breakout zone before continuing upward — this indicates a healthy trend continuation.
Entry Strategy:
Entry: After a breakout and a confirmation candle closes above the wedge line.
Stop Loss (SL): Placed below the wedge’s low.
Take Profit (TP): Use the wedge’s height projection or target the next resistance level.
AGX trade ideas
AGX GROUP BERHADAGX GROUP BERHAD
Trend: The stock has shown a strong upward trend recently, with a significant price increase from late July to early August.
Support and Resistance: The current price seems to be encountering resistance around the 0.545 level (marked as "High" on the chart). Support levels could be around 0.480-0.500, based on recent price action.
Moving Averages: Two moving averages are visible on the chart. The shorter-term MA (likely 20-day) has recently crossed above the longer-term MA (possibly 50-day), which is typically a bullish signal.
Volume: There's been a notable increase in trading volume accompanying the recent price surge, indicating strong buying interest.
Volatility: The stock has experienced increased volatility in recent days, with larger price swings and longer candlesticks.
Candlestick Patterns: The most recent candle shows a bearish pattern, possibly indicating a short-term pullback or consolidation.
Momentum: Despite the recent pullback, the overall momentum appears bullish based on the steepness of the recent uptrend.
Bollinger Bands: While not explicitly shown, the recent price action suggests the stock may have been trading above its upper Bollinger Band, indicating overbought conditions.
Overall, the stock shows a strong bullish trend but may be due for a short-term pullback or consolidation. Traders should watch for support levels holding and potential continuation of the uptrend, while also being cautious of potential reversals given the rapid recent gains.

AGX, below IPO price.Listed since February. Currently below IPO price.
>> Price below Hull MA
>> Oversold counter
Didn't see any strong reversal. Either skip or monitor if interested into this counter.
When a stock / index has gone up substantially, we must be more care if we decide to get involve in it...
monitor closely and be agile....
we cannot PREDICT what definitely will happen ~ we can only RESPONSE to what we see!
Disclaimer: Mentioned stocks are solely based on own opinions for education and/or discussion purpose only. There's no buy and/or sell recommendation. Trading involve financial risk on your own. The author shall not be responsible for any losses or lost profits resulting from investment decisions based on the use of the information contained herein.
