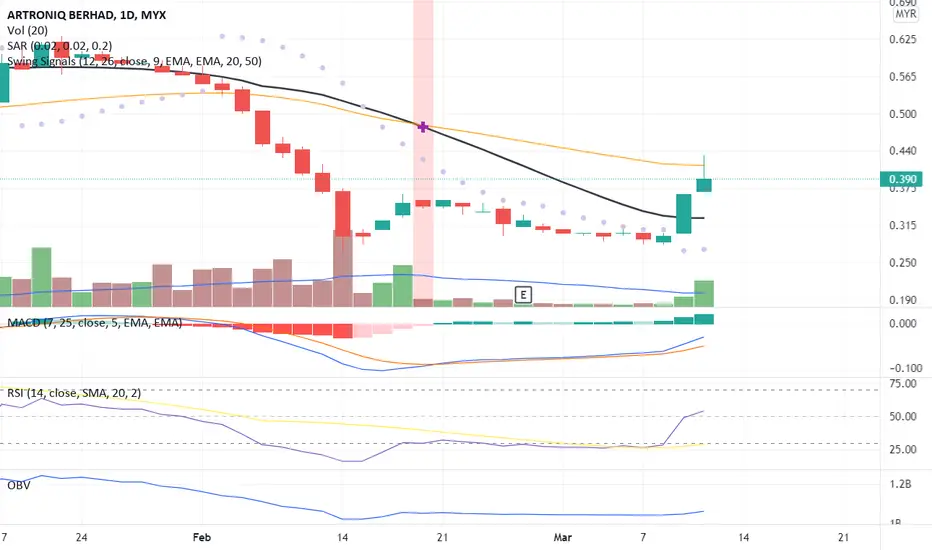
MY: Artroniq Analysis. Possible re-entry Opportunity?Artroniq gives another discounted price if anyone missed when it dropped to 0.19. Dropped to fibo levels, can break down fibo levels and nullify Buying opportunity or Is it a good bargain now to hunt this kind of counters? Lets wait and see.
−0.065 MYR
−20.93 M MYR
25.44 M MYR
437.55 M
About ARTRONIQ BERHAD
Sector
Industry
Website
Headquarters
Kuala Lumpur
Founded
2002
ISIN
MYQ0038OO008
FIGI
BBG000GNLHB8
Artroniq Bhd. is an investment holding, which engages in the provision of management services. It operates through the following segments: Management Services, Trading of ICT Products and Related Services, and Semiconductor. The company was founded on August 29, 2002 and is headquartered in Kuala Lumpur, Malaysia.
Related stocks

MY: Artroniq Analysis 24/11/23Strong bullish trend seen. Can it go to 0.92 and to its all time high 1.02++??
High risk trader can enter now, low risk trader can wait for pullback for entry.
P/s: This is not a Buy/Sell call. Please due diligence before enter any trade.....

The OBV line has been steadily increasing - ARTRONIQBased on the chart and the On-Balance Volume (OBV) indicator, ARTRONIQ appears to be in an uptrend. The OBV line has been steadily increasing, indicating that buying pressure is increasing. Additionally, the stock has recently broken through a resistance level at around RM0.75, which is a bullish si


ARTRONIQEP 0.585
TP 0.61
SL 0.575
Backtest result from 2022-08-04 09:00:00
31 trades
61% win rate
p.s: not a financial advice
#deepagiscreener #TAYOR #bursa

ARTRONIQ rebounding at fibo786Can try ARTRONIQ which appears to have rebounded at fibo786 which is 0470. Proposed EP is at current price and the proposed TP is at fibo618 which is 0.630. Proposed CL is below recent swing low at 0.410.

Morning Star ⭐Despite a slump throughout the month, the share price has rebounded at Fibonacci support level 0.786, forming a set of bullish candles identified as Morning Star, which our bullish view. The price may head north to test resistance at 0.70, followed by 0.97 and 1.21. On the flipside, price movement b

A Breakout Signal!The RSI indicator indicates a strong gain momentum where crosses up indexes 50. Where the price momentum towards the MA50 line as a price resistance line. The volume also closed above the MA20 line.
MACD and OBV indicators confirmed the price uptrend movement towards the resistance line.
Let's sav
A Reversal Signal!The candlestick pattern indicates a divergence signal where the direction of a price trend has changed, from going down to going up, with volume crosses over the MA20 line.
The RSI indicator indicates an uptrend with gain momentum towards indexes 30. Hence, confirming the price reversal towards the

See all ideas
Summarizing what the indicators are suggesting.
Oscillators
Neutral
SellBuy
Strong sellStrong buy
Strong sellSellNeutralBuyStrong buy
Oscillators
Neutral
SellBuy
Strong sellStrong buy
Strong sellSellNeutralBuyStrong buy
Summary
Neutral
SellBuy
Strong sellStrong buy
Strong sellSellNeutralBuyStrong buy
Summary
Neutral
SellBuy
Strong sellStrong buy
Strong sellSellNeutralBuyStrong buy
Summary
Neutral
SellBuy
Strong sellStrong buy
Strong sellSellNeutralBuyStrong buy
Moving Averages
Neutral
SellBuy
Strong sellStrong buy
Strong sellSellNeutralBuyStrong buy
Moving Averages
Neutral
SellBuy
Strong sellStrong buy
Strong sellSellNeutralBuyStrong buy
Displays a symbol's price movements over previous years to identify recurring trends.
Frequently Asked Questions
The current price of ARTRONIQ is 0.080 MYR — it hasn't changed in the past 24 hours. Watch ARTRONIQ BERHAD stock price performance more closely on the chart.
Depending on the exchange, the stock ticker may vary. For instance, on MYX exchange ARTRONIQ BERHAD stocks are traded under the ticker ARTRONIQ.
ARTRONIQ stock hasn't changed in a week, the month change is a −5.88% fall, over the last year ARTRONIQ BERHAD has showed a −57.89% decrease.
ARTRONIQ reached its all-time high on Apr 12, 2022 with the price of 1.210 MYR, and its all-time low was 0.050 MYR and was reached on Aug 9, 2011. View more price dynamics on ARTRONIQ chart.
See other stocks reaching their highest and lowest prices.
See other stocks reaching their highest and lowest prices.
ARTRONIQ stock is 0.00% volatile and has beta coefficient of 0.09. Track ARTRONIQ BERHAD stock price on the chart and check out the list of the most volatile stocks — is ARTRONIQ BERHAD there?
Today ARTRONIQ BERHAD has the market capitalization of 35.90 M, it has increased by 6.25% over the last week.
Yes, you can track ARTRONIQ BERHAD financials in yearly and quarterly reports right on TradingView.
ARTRONIQ net income for the last quarter is −788.00 K MYR, while the quarter before that showed 6.02 M MYR of net income which accounts for −113.08% change. Track more ARTRONIQ BERHAD financial stats to get the full picture.
EBITDA measures a company's operating performance, its growth signifies an improvement in the efficiency of a company. ARTRONIQ BERHAD EBITDA is −18.86 M MYR, and current EBITDA margin is −74.46%. See more stats in ARTRONIQ BERHAD financial statements.
Like other stocks, ARTRONIQ shares are traded on stock exchanges, e.g. Nasdaq, Nyse, Euronext, and the easiest way to buy them is through an online stock broker. To do this, you need to open an account and follow a broker's procedures, then start trading. You can trade ARTRONIQ BERHAD stock right from TradingView charts — choose your broker and connect to your account.
Investing in stocks requires a comprehensive research: you should carefully study all the available data, e.g. company's financials, related news, and its technical analysis. So ARTRONIQ BERHAD technincal analysis shows the sell today, and its 1 week rating is sell. Since market conditions are prone to changes, it's worth looking a bit further into the future — according to the 1 month rating ARTRONIQ BERHAD stock shows the sell signal. See more of ARTRONIQ BERHAD technicals for a more comprehensive analysis.
If you're still not sure, try looking for inspiration in our curated watchlists.
If you're still not sure, try looking for inspiration in our curated watchlists.