BIG trade ideas

BIG REBOUNDING FROM FIBO618Can try BIG as spotted reboudnding from fibo618 in daily chart. EP, TP and CL as per proposed trade plan. Tight CL on purpose to manage downside.

BIG - Trendline breakoutPrice has broken the trendline on 09/08/2022. Let's wait for little pullback formation before placing our entry.
Would this indicates for MYX:BIG to change direction to uptrend?
Potential entry:
1) RM0.785 - RM0.795
2) RM0.720 - RM0.755 (Suitable for long-term)
Resistance:
RM0.84 / RM0.985
Support:
RM0.695
Disclaimer: This trading idea is for education purpose only. This is not a buy call nor a stock recommendation. Please trade at your own responsibility.

B.I.G INDUSTRIES BHD FORCAST : SELL- on the monthly chart : we notice the price had reachd a level that it didn't hit for a very long time
- on the weekly chart : hitting the resistance level with force but rejecting it
- on the daily chart : the last candle shows a clrea rejection for that level and a confirmation today
- personal opinion : the price reachd that level with good force and momentum to break it . but that last candle on the daily shows a massive decrease in that force wich might cause a rejection . so i say theres a 80% chance the price will reject the level cause of that candle and also the history of the price and how it behave near it
- best move : SELL

ELLIOT WAVE | BIG INDUSTRIES BHDBIG industries Bhd
- Very hot stock past 2 weeks, waiting for another game play. Might be a profitable trade for swing trader
IDEA TRADING TEKNIKAL
1. Head and shoulder pattern spotted waiting for breakout confirmation with volume = sincere BO
2. Moving average tersusun cantik = strong uptrend
3. Entry level pada MA20 and MA50, TF daily
4. breakout downtrendline and able to succeed above + formation of HH and HL
IDEA TRADING FUNDAMENTAL
1. Quarter report 3 quarter constant making profit = something brewing
2. ROA, ROIC, ROE improve for 5 years

BIG in Bullish Harmonic PatternBIG's chart pattern resembles that of BAT's XABCD harmonic pattern where point D is most probably the Potential Reversal Zone.
The probable EP would be at 0.825 (current price) and the probable initial TP would at 1.075 which is the daily pivot level and was tested recently. 1.075 is also a yearly pivot resistance. The probable CL would be below Point D.

BIG - BIGGER - BIGGEST - BIGGESTESTFrom chart:
- Wave formation observed (1-2-3-4)
Trading Strategy:
- Wait for entry zone and entry based on PAV
- Straight entry if sudden volume coming in for following week
Business Nature:
Concrete, Property and etc
I am nubis, i am non-premium members ..follow if you think this idea make sense..just sit back, relax and make some money.
-Heil_Z-
# Are-snuff Traders Club
# Bilis Traders Group

A Breakout Signal!A breakout signal from a significant price movement. Hence candlestick closed above MA20 with volume above MA20. MACD and OBV charts show an early stage of divergence. High probability will have a price correction because retailers might sell it much earlier for a profit. Put this in your WL and watch out for price and volume movement together with MACD and OBV divergence signal. To place a bid, use VWAP as a guideline and place your bid below the VWAP line.
R 1.455
S 1.060

BIG going bigBIG with 3 green soldiers on daily candle and possible bullish coming..
Daily candle looks Good
Should break next Resistance and shoot above 1.60
Need to cross up 1.550
Next daily candle and today to confirm bull coming
Low selling pressure

BIG breakout Symmetrical triangleBIG just breakout symettrical triangle TF 1 hour frame Chart.
Retrace to valid trend line 1.460 and possible To continue uptrend Channel to test NEXT resistance 1.660
To break minor resistance and bullish up coming For BIG

BIG which is small in Shares Float @52M Shares-Easy to ?Manipulate. Not encourage for investor type, good for traders may be if? Last Quarter making RM11k profit only. Reasonable price for for me is RM0.15 only. This is like buying Viva at the price of BMW5 series.
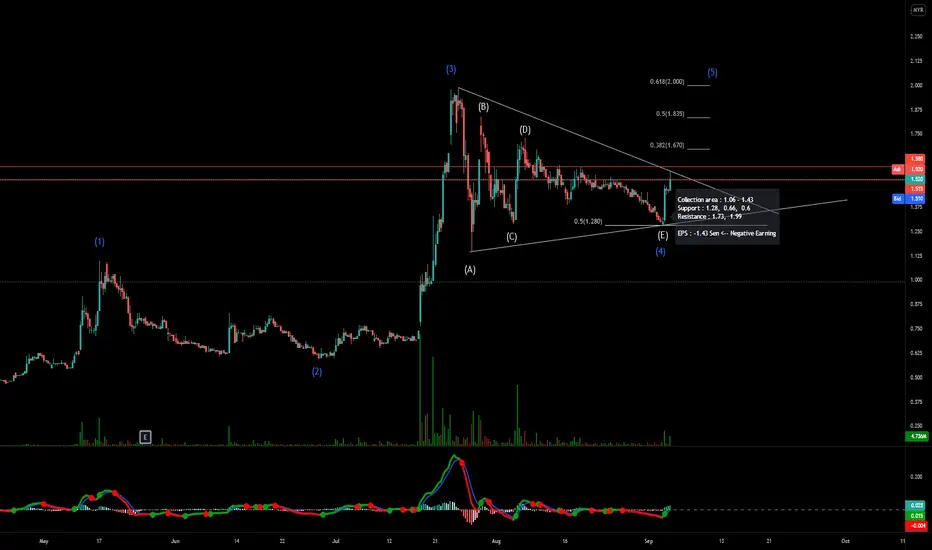
BIG 1hr chart 5 waves impulse.BIG 1hr chart 5 waves impulse.
Wave 3 fib 161% of wave 1 (RM1.95)
wave 4 double three structure terminated at fib 61.8% of wave W and X.
Wave 5 should end inside the blue box.
Exactly dia follow EW guidelines.
1.59, 1.68, 1.99 all possible profit taking price

BIG start rebound at Fibo Speed Resistance Fan for the next waveBIG rebound with volume on 0.618 Fib Speed Resistance Fan. Based on EW, possible for the next wave 5


BIG This stock with momentum is generated using a FIFO B signal with a build-up in trading volume and price.
This is not a buy or sell recommendation. It merely tells you which this stock is seeing higher potential to move uptrend with relatively strong momentum.
The share price may move up or down from this point. Note also that momentum generally only persists for a short period of time.
However, this stock has an accompanying fundamental score and valuation score to help users evaluate the attractiveness of the stocks if they want to ride the momentum.

BREAK TRIANGLEBig potential to break triangle after previous triangle
good to keep follow up and add watchlist

BIG miracle on the way?most indicator showing a positive result
Fresh breakout
Only MACD not properly crossed up
RSI within oversold region not yet reaching >50
#tayor

Big IndustriesTrade ideas for this counter..
Weekly TF show sellers dominate the counter.. However, price already make new HH and break and close above weekly resistant.
Wait for further retracement preferably at green zone area where inside bar breakout which inline with trendline..
Watch also RBS area 0.51 to see any rejection before entry.
Happy Trading
Tayor.

