BURSA - Weekly Long Term Directional BiasPlease consider your own interpretation of Opportunity & Risk:
Green Arrow (Transparency = 0) = Representing Upside
Red Arrow (Transparency = 0) = Representing Downside
Green Arrow (Transparency = 30%) = Representing Alternate Price Path, or less probable outcomes
Red Arrow (Transparency = 30%) = Representing Alternate Price Path, or less probable outcomes
NO BUY CALLS OR INVESTMENT ADVISED ARE PROVIDED.
DISCLAIMER: This analysis is for reference and learning purposes only. It is based on my personal view in the market from a technical analysis standpoint. None of information posted in this chart can be used as investment decisions or investment advises to any parties. Do not trade solely on the information posted in this page. Trade at your own risk and judgement. A trader could potentially lose all money. Only risk capital that can be lost without jeopardizing ones financial security of lifestyle. Please seek licensed professional guidance if you plan to invest your capital seriously.
PENAFIAN: Analysis ini hanyalah untuk tujuan rujukkan dan pembelajaran sahaja dan bukan cadangan untuk membeli atau menjual stok atau apa jua jenis instrumen kewangan. Anda dinasihatkan untuk menghubungi remieser / dealer / bank pelaburan yang mempunyai lesen atau kelayakan yang sah untuk bertanyakan pendapat dan menguruskan pelaburan anda. Pelaburan dan perdagangan mempunyai risiko tinggi, dan ianya adalah Risiko Anda Sendiri.
BURSA trade ideas


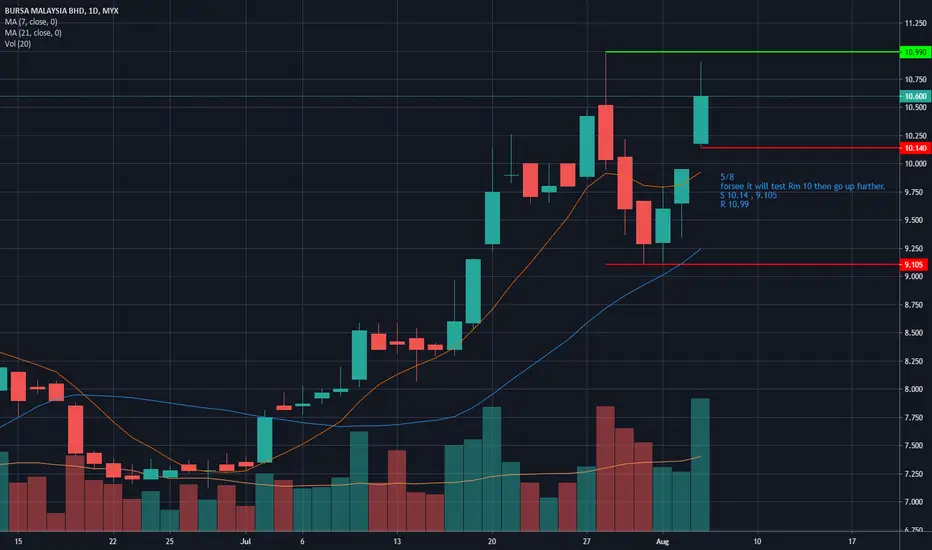
Bursa, Support line need to hold9.13 is the support line. Look at that hot red money is running out...


BURSA - DT If Resistance Break Fails, Need More Buy Up VolumeDT = Double Tops Bearish Reversal Chart Pattern
Please consider your own interpretation of Opportunity & Risk:
Green Arrow (Transparency = 0) = Representing Opportunity
Red Arrow (Transparency = 0) = Representing Risk
Green Arrow (Transparency = 30%) = Representing Alternate View for Opportunity, or less probable outcomes
Red Arrow (Transparency = 30%) = Representing Alternate View for Risk, or less probable outcomes
NO BUY CALLS OR INVESTMENT ADVISED ARE PROVIDED.
DISCLAIMER: This analysis is for educational and informational purposes only. It is based on my personal view in the market from a technical standpoint. None of information posted in this page can be used as investment decisions except for educational purpose only. Do not trade solely on the information posted in this page. Trade at your own risk and judgement. A trader could potentially lose all money. Only risk capital that can be lost without jeopardizing ones financial security of lifestyle. Please seek licensed professional guidance if you plan to invest your capital seriously.
PENAFIAN: Analysis ini hanyalah untuk tujuan pembelajaran & pendidikan sahaja dan bukan cadangan untuk membeli atau menjual stok atau apa jua jenis instrumen kewangan. Anda dinasihatkan untuk menghubungi remieser / dealer / bank pelaburan yang mempunyai lesen atau kelayakan yang sah untuk bertanyakan pendapat dan menguruskan pelaburan anda. Pelaburan dan perdagangan mempunyai risiko tinggi, dan ianya adalah Risiko Anda Sendiri.

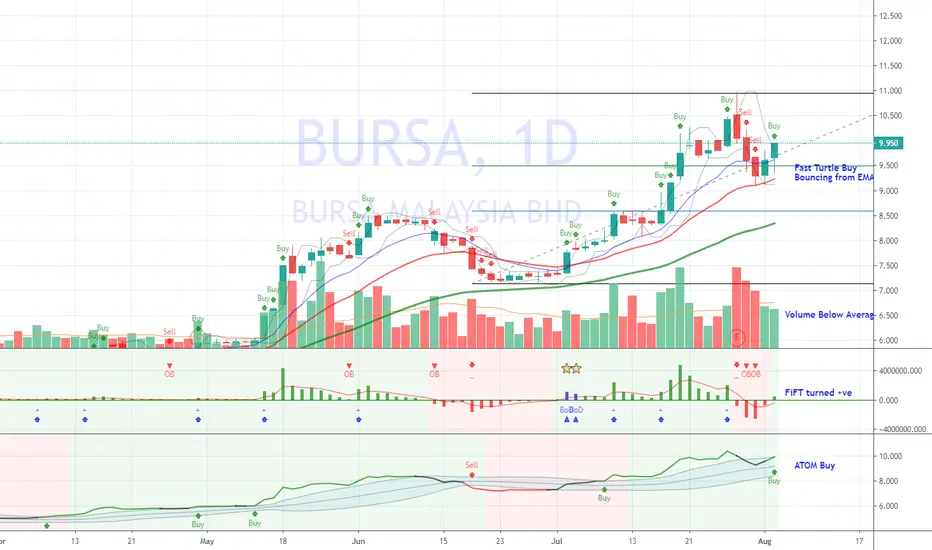
BURSA - Buy on Dip CandidateFast Turtle Buy 9.8 bouncing from EMA20 and Fibo 0.382.
FiFT turned +ve
ATOM Buy.
The only concern volume is below average.
Can consider buy on pullback. SL below 9.1
Bursa poised to charge the bullBursa volume of trading will contribute to its earning, hence justified the price increase.
The chart shows the trading ideas previously in expectation of Covid-19 demise. Low and bottom feeder.
Then due to stimulus plan, Bursa rebounded strongly, meeting the expectation. MCO contributed positively to market as a whole, and specific to Bursa.
We had seen ABSORPTION in the congestion area, signifying SOS in our Wyckoff assessment, circa the yellow box below RM6.
Then the trading volume surged from decent 3-5b to 9-14b. And we opined to always enter during temporary weakness (BOW).
#WyckoffMethod

BURSA - Possible end of retracementHi, I think BURSA will continue back the move up after recent retracement down to area of horizontal line A which was a major resistant-turned-support line on higher TF.
Bar 1 was the climactic bar, with ultra high volume, meaning buyers entered to slow down the down move.
Bar 2 was a No Supply bar.
Bar 3 was a spring, meaning that price broke below the recent minor support then closed back up
Bar 4 was a nother NO SUPPLY bar
On Weiss wave indicator, wave number 6 had lower cummulative volume than wave 7, probably indicating selling interest had become exhausted.
I'm looking forward for price to move back up.
Trade at your own risk, any comments are welcomed.


BURSA buy (?)I can see BURSA reaching RM8.10 in the coming months. With their first dividend announced, I think BURSA is a good stock to buy and hold for the first half of the year. What are others thinking?

