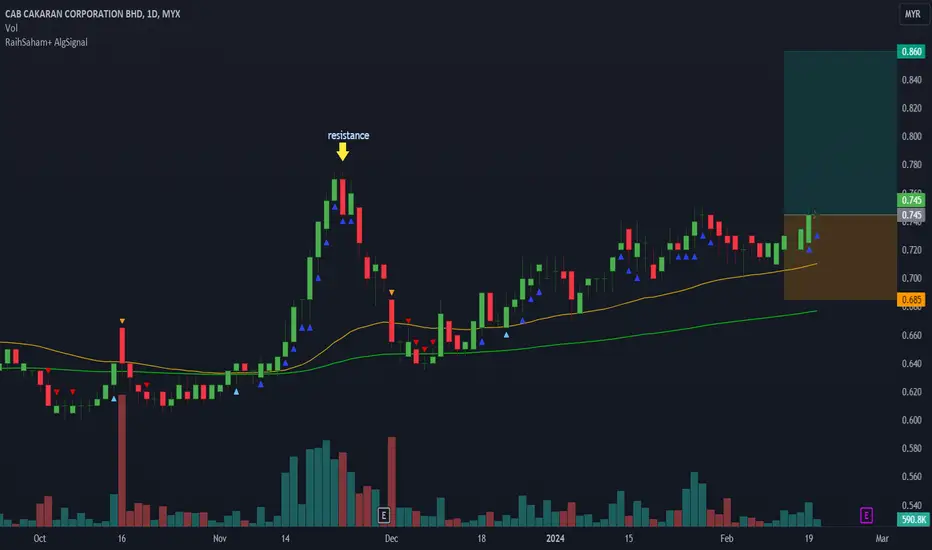
CAB, AlgoSignal reveals potential uptrendSeveral indicators within my algorithmic system are signaling a potential uptrend. These include:
- Increased volume: Activity is picking up, suggesting growing interest and potential momentum.
- Mid- to long-term uptrend: Both the 50-day and 150-day exponential moving averages are pointing upward, indicating a sustained positive trajectory.
These factors collectively point towards the possibility of an upward movement in the near future
CAB trade ideas
triangle patternCAB follow the triangle pattern, cut lost point should be set around 0.61/0.615 . 9 month QR in good result but share price just maintain around the range, it is not a good sign. anyway its in the chart pattern for me to follow. make clear that I do not hold any position. only a study case.

CAB : Filter 3 has appeared at M15The appearance of filter 3 indicates a strong breakout signal with price and volume confirming the upward momentum.
The MACD crossing above the zero line is often considered a bullish signal.
If the price breaks F3's high, it is more likely the price will make new high.
TAYOR.

CAB VCP SetupPrevious CAPITALA and KPPROP VCP got good return (~30%). Hopefully some of you manage to get that ride too.
Here you go for another VCP candidate:
C1: -21%
C2: -8%
C3: -4%
Note on the recent price/volume action. Brewing for something.
Let's see the upcoming movement.


CAB is going for the last leg up for RAYA festivalBased on EWO, it is possible that CAB is going for the last leg of smaller W-5 to TP area in blue line.
This is in sync with chicken price hike especially during festival.
Next would be a retracement, it could be shallow or deep retracement and based on the current hype, it should be shallow.
Happy Eid everyone

CAB in ABC formation.CAB in ABC formation.
Rebounded at EMA100 and Fibo618 at 0.490.
Probable EP is at 0.490 to retest EMA100 and Fibo618.
Probable TP is 52wh at 0.565.
Probable CL is below EMA200 and Fibo786 at 0.465.
This is for study purposed only and not an investment call.


CAB - CUP & HANDLE PATTERN (BULLISH)Based on the CAB stock chart, the stock should has completed its cup & handle pattern.
If today price broke and stayed above 0.51, it further confirms the uptrend and signifies another buy trade signal.
Happy trading!

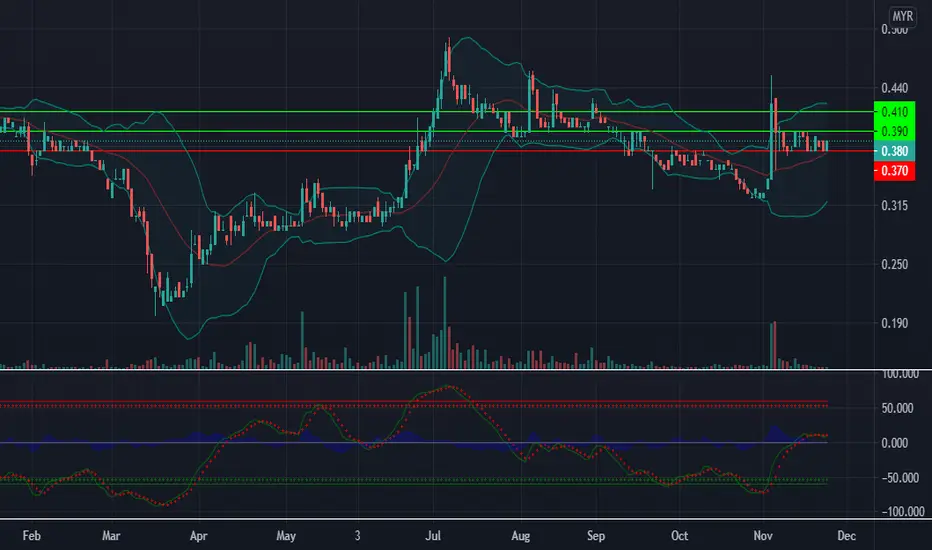
CAB AnalysisNon-syariah counter
Price around Bollinger mid band
Entry Price: 0.370
Cut loss: 0.360
TP1: 0.390
TP2: 0.410


CAB 3MEP : 330
CL : 290 or MA20 touch red candle
S : 300
R1 : 340
R2 : 375
TP : Follow MA20
Number of Share: 690.51m

Is CAB Cakaran able to breakdowntrend line and EMA2001) Short term candle pattern shows a price increasing from support 0.405. Its strong support.
2) EMA20 is facing upwards and possible to cross EMA50. Bullish signal.
3) If can break the white line , its breakout of midterm downtrend line.
4) Beware on EMA200 line

Mampukah CAB memecahkan kumo cloud dan meneruskan pendakian?CAB membuat tapak yang sangat kukuh pada aras 0.405 dan selepas itu membuat tujahan yang sangat kuat. Aras yang perlu di pecahkan adalah kumo cloud bagi menentukan kekuatan CAB meneruskan pendakian. Sama-sama kita follow rapat dan siapkan trading plan ya. (Sekadar kajian dan pembelajaran).

<TradeVSA> Line Change at Support - CCK & CABStrength at the chart:
1. Shakeout / removal of supply at the background
2. Strong support with strength
Send us your preference stock to review based on TradeVSA chart by comment at below.
Disclaimer
This information only serves as reference information and does not constitute a buy or sell call. Conduct your own research and assessment before deciding to buy or sell any stock

Why You Have to Pay Attention to CAB CakaranStrength in the chart:
1. High volume 18 Line change bar confirmed the accumulation
2. Pullback in 1st 18LC shown Smart Money have removed weakhand holders
Send us your preference stock to review based on TradeVSA chart by comment at below.
Disclaimer
This information only serves as reference information and does not constitute a buy or sell call. Conduct your own research and assessment before deciding to buy or sell any stock

Potential Retest 0.99...Trendline breakout and pulback...
Potential moving up if able to maintain above 0.9

CAB (7174) - Possible bottom formationCAB is looking good with possibility of bottom formation. By looking at chart, CAB is creating higher low and higher high with good volume, which means it has a good momentum. CAB also breakout from down-trend line with high volume. The indicators and oscillators are showing bullish signs.
Next resistance is RM 1.00. Breakout above RM 1.00 with high volume will see it goes to next resistance level at RM 1.10.
Breakout above RM 1.10 will make this counter into bullish mode.
This counter is currently lagging behind CCK and QL.
*All views here are for learning purposes only, not a recommendation to buy or sell any stock.
