0.035 MYR
6.81 M MYR
36.25 M MYR
About CEKD BERHAD
Sector
Industry
CEO
Kai Ning Yap
Website
Headquarters
Kuala Lumpur
Founded
1989
ISIN
MYQ0238OO004
FIGI
BBG012DZQS66
CEKD Bhd. is an investment holding company, which engages in the provision of die-cutting solutions. It operates through the following segments: Manufacturing, Trading, and Investment Holding. The Manufacturing segment includes manufacturing die cutting moulds. The Trading segment focuses on trading related consumables, tools, and accessories. The Investment Holding segment is involved in investments in shares of subsidiaries. The company was founded in 1989 and is headquartered in Kuala Lumpur, Malaysia.
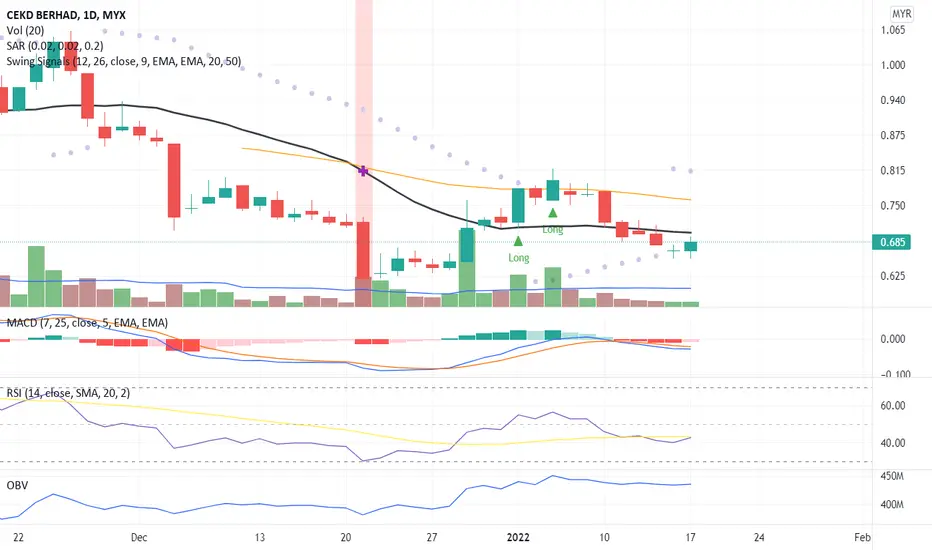
A Reversal Signal!The candlestick indicates a reversal pattern where the price has a possibility to close above the MA20 line with high volumes supporting the price momentum.
RSI and OBV indicate a divergence signal and confirm the price momentum to the next resistance price level.
Let save CEKD in WL and watch out
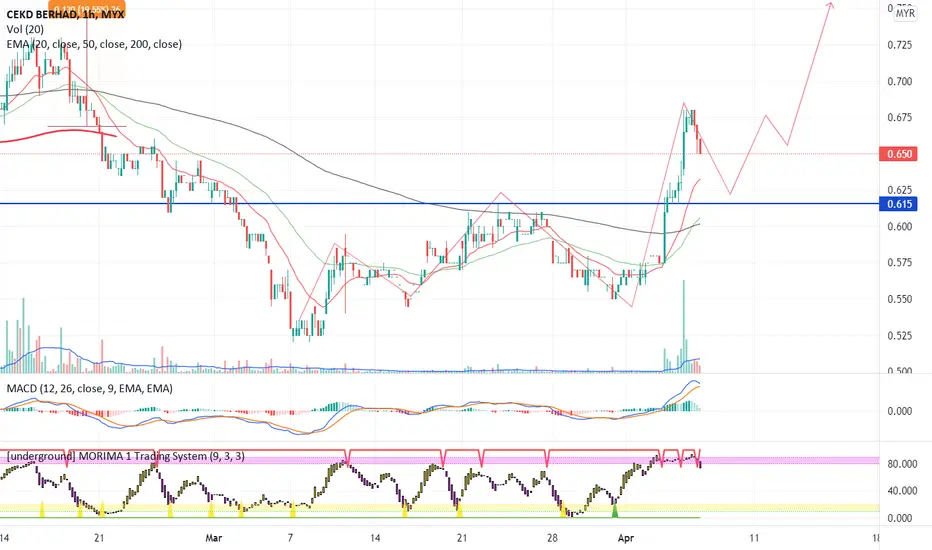
An Uptrend Pattern!With significant price movement and support from volume over MA20, CEKD has the potential for an uptrend pattern towards the peak price.
MACD and OBV charts indicate a confirmed price uptrend pattern.
Let put CEKD in WL and watch out for significant price movement and when the price is above the M

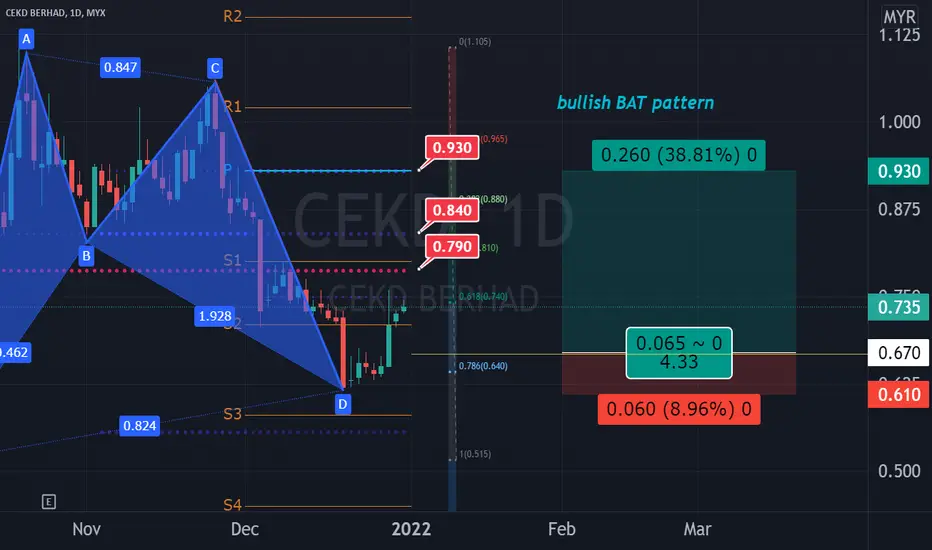
CEKD IN BULLISH HARMONIC PATTERNCEKD in BULLISH HARMONIC PATTERN. CEKD's chart resembles that of a bullish BAT harmonic pattern as per the wave's respective Fibonacci levels. Therefore, above Point D is the Potential Reversal Zone (PRZ). To enter trade, the probable retracement EP is 0.670 which is a 4htf pivot point and the proba
CEKD, is it possibleSimple trading idea
using SNR and Price Action
can consider
momentum still inside
plan ur trade

CEKDcurrently price test major support
tend to break DTL if to continue uptrend
otherwise need to stop loss at nearest HL structure using tf30m
maybe tomorrow or next 2-3 day the volume will try to test the resistence.
Trade at ur own risk

CEKDWait For Bo
For Short Term Trade
New Counter
Uptrend
Volume Still Bias To Uptrend
Price Up, Volume Up..Bias To Uptrend,
Possible To Continue Uptrend
Tayor

See all ideas
Summarizing what the indicators are suggesting.
Oscillators
Neutral
SellBuy
Strong sellStrong buy
Strong sellSellNeutralBuyStrong buy
Oscillators
Neutral
SellBuy
Strong sellStrong buy
Strong sellSellNeutralBuyStrong buy
Summary
Neutral
SellBuy
Strong sellStrong buy
Strong sellSellNeutralBuyStrong buy
Summary
Neutral
SellBuy
Strong sellStrong buy
Strong sellSellNeutralBuyStrong buy
Summary
Neutral
SellBuy
Strong sellStrong buy
Strong sellSellNeutralBuyStrong buy
Moving Averages
Neutral
SellBuy
Strong sellStrong buy
Strong sellSellNeutralBuyStrong buy
Moving Averages
Neutral
SellBuy
Strong sellStrong buy
Strong sellSellNeutralBuyStrong buy
Displays a symbol's price movements over previous years to identify recurring trends.
Related stocks
Frequently Asked Questions
The current price of CEKD is 0.360 MYR — it hasn't changed in the past 24 hours. Watch CEKD BERHAD stock price performance more closely on the chart.
Depending on the exchange, the stock ticker may vary. For instance, on MYX exchange CEKD BERHAD stocks are traded under the ticker CEKD.
CEKD stock has fallen by −4.00% compared to the previous week, the month change is a −1.37% fall, over the last year CEKD BERHAD has showed a −32.71% decrease.
CEKD reached its all-time high on Oct 18, 2021 with the price of 1.110 MYR, and its all-time low was 0.300 MYR and was reached on Mar 11, 2025. View more price dynamics on CEKD chart.
See other stocks reaching their highest and lowest prices.
See other stocks reaching their highest and lowest prices.
CEKD stock is 0.00% volatile and has beta coefficient of 0.22. Track CEKD BERHAD stock price on the chart and check out the list of the most volatile stocks — is CEKD BERHAD there?
Yes, you can track CEKD BERHAD financials in yearly and quarterly reports right on TradingView.
CEKD net income for the last quarter is 1.42 M MYR, while the quarter before that showed 2.09 M MYR of net income which accounts for −32.33% change. Track more CEKD BERHAD financial stats to get the full picture.
CEKD BERHAD dividend yield was 4.26% in 2024, and payout ratio reached 57.14%. The year before the numbers were 1.55% and 29.07% correspondingly. See high-dividend stocks and find more opportunities for your portfolio.
As of Jun 17, 2025, the company has 206 employees. See our rating of the largest employees — is CEKD BERHAD on this list?
EBITDA measures a company's operating performance, its growth signifies an improvement in the efficiency of a company. CEKD BERHAD EBITDA is 12.91 M MYR, and current EBITDA margin is 33.35%. See more stats in CEKD BERHAD financial statements.
Like other stocks, CEKD shares are traded on stock exchanges, e.g. Nasdaq, Nyse, Euronext, and the easiest way to buy them is through an online stock broker. To do this, you need to open an account and follow a broker's procedures, then start trading. You can trade CEKD BERHAD stock right from TradingView charts — choose your broker and connect to your account.
Investing in stocks requires a comprehensive research: you should carefully study all the available data, e.g. company's financials, related news, and its technical analysis. So CEKD BERHAD technincal analysis shows the strong sell today, and its 1 week rating is sell. Since market conditions are prone to changes, it's worth looking a bit further into the future — according to the 1 month rating CEKD BERHAD stock shows the sell signal. See more of CEKD BERHAD technicals for a more comprehensive analysis.
If you're still not sure, try looking for inspiration in our curated watchlists.
If you're still not sure, try looking for inspiration in our curated watchlists.