A Breakout Signal!The price candlestick body closed above the MA20 line with the volume confirming the price significant movement.
The RSI index indicates a strong gain than the losses. Hence, align with the price spike uptrend movement.
MACD and OBV indicate an uptrend divergence pattern and align with the price moving towards an uptrend pattern.
Precaution for a price correction between 10% to 20% from the recent price peak before continuing to the next price resistance.
Let's save CHEETAH in WL and watch out for significant price movement with volume supporting the price movement.
R 0.220
S 0.195
CHEETAH trade ideas

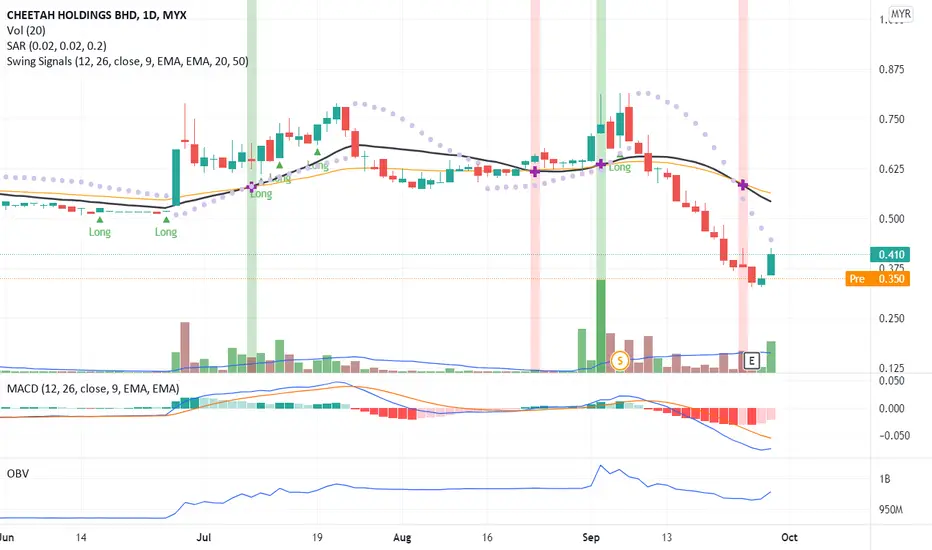
A Reversal Signal!The candlestick shows a significant price movement from previous traded. Hence a Reversal Signal. OBV chart shows a divergence signal but MACD chart is still in a negative pattern since MACD not yet crosses up signal line. A confirmation uptrend pattern is when MACD and OBV charts show a divergence signal. At this moment, please bid carefully by closely monitor the support line. CHEETAH has the potential in the next wave. Put in your WL and watch out for significant price movement.
R 0.450
S 0.335
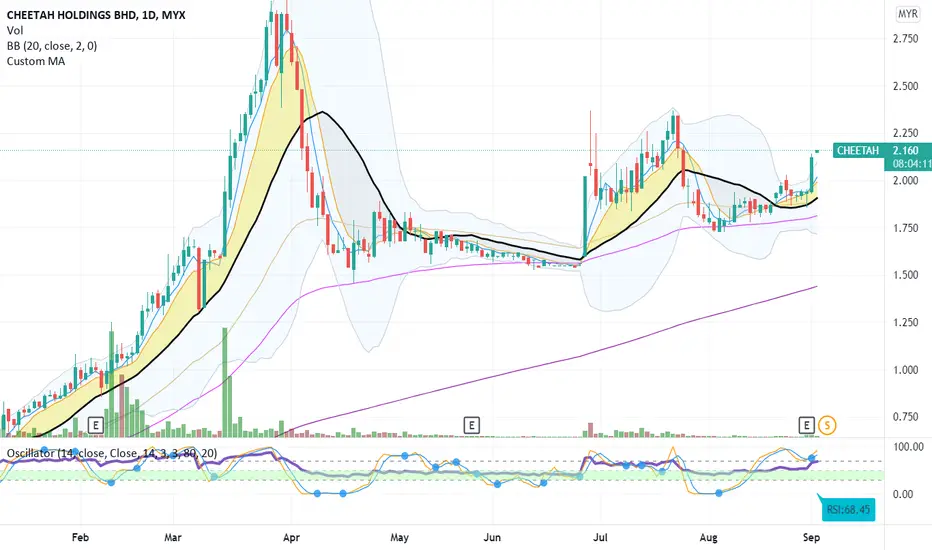
Is CHEETAH in Rally Up?Significant price movement makes CHEETAH Break-Out (BO) from Bollinger band with lesser volume support the increase compared to the previous trade day. The Bollinger band chart showing an uptrend pattern. Will it be able to hit the next resistance at 2.34? Let see CHEETAH performance on Friday.
CHEETAH - History repeat itself???MYX:CHEETAH
Today, there is a cross between the green and red lines (referring to EPRAF), a sign of the beginning of the uptrend phase.
Is CHEETAH going to start repeating its history ???

Swing Trategy TAVASector: Consumer Products & Services
Swing entry will appear after recent SS. Wait for entry once current price above both EMAs crossing.
RRR: 1:1
Disclaimer:
You should not engage in trading unless you fully understand the nature of the transactions you are entering into and the extent of your exposure to loss. If you do not fully understand these risks you must seek independent advice from your financial advisor. All trading strategies are used at your own risk.

