CORAZA - POTENTIAL PRICE MOVEMENT.N wave with E, N & NT projection.
The price is above the Kumo with Tenkan-sen as immediate support (0.480).
Price needs to maintain above NT level (0.490), confirming bullish continuation and act as immediate resistance.
Entry: Consider entering a long position if the price convincingly breaks above the NT projection level (around 0.490) with volume confirmation.
Stop Loss: Place a stop-loss just below the recent low, around 0.460, to manage downside risk.
Target Levels:
Initial target (N wave projection): 0.535
Extended target (E wave projection): 0.580
Note:
1. Analysis for education purposes only.
2. Trade at your own risk
CORAZA trade ideas

CORAZA - Bullish continuationEntry & exit strategy with Fibonacci retracement line.
The price has experienced a significant rally, indicating bullish momentum.
52w High (0.675): This is a critical resistance level that the price has tested. A confirmed breakout above this level indicates bullish strength.
The price is currently trading above the Kumo, suggesting a bullish trend.
Chikou-span is above the price and Kumo, further confirming the bullish sentiment.
The Tenkan-Sen and Kijun-Sen lines are trending upwards, supporting the bullish momentum.
Fibonacci Retracement Levels:
Entry 1: 50% retracement at 0.600.
Entry 2: 38.2% retracement at 0.580.
These levels offer potential buy zones in case of a pullback.
Stop loss below 0.540 (14.4% Fibonacci level).
Note:
1. Analysis for education purposes only.
2. Trade at your own risk.

CORAZA - PENDING BREAKOUT ?CORAZA - CURRENT PRICE : RM0.570
On 27 NOVEMBER 2024, an extended long white real body candlestick gapped higher on the opening and closed at near the session's high. This tall white candle confirmed an important breakout from down trendline. Then the stock continue its upside movement.
On 31 DECEMBER 2024, the stock hit intraday high at RM0.575 and closed RM0.570.
RM0.575 may considered as immediate resistance level as the share price touched this level three times. A breakout above RM0.575 may propel the share price higher in the upcoming session. As such, technically if the stock made a breakout above RM0.575, I would buy this stock. My entry price will be RM0.580/RM0.585.
ENTRY PRICE : RM0.580/RM0.585
TARGET PRICE : RM0.625
STOP LOSS : RM0.545 (the low of 31 DECEMBER 2024)
TAYOR !

Bullish- Monthly already have 5 wave.
- Weekly already have 5 wave, in wave 5 monthly (wave in wave)
- Might have some correction in the blue box for wave B or wave 2.
- If exceed 0.580, target price will be in the red box (between 0.615 - 0.720)

CORAZA, Capitalsahamplus Algo TradingSystem Remisier CheDinThe current point exhibits upward signals according to my algorithmic system, meeting various criteria. These include rising trading volume, an upward trend indicated by prices above EMA20 and EMA50, and the closing price surpassing VWAP. As a result, the present conditions suggest a potential upward trend.

CORAZA- Fresh breakout major downtrend
- Noticed volume coming in
- Expect to retrace
- Tp as projection

CORAZA- Fresh breakout major downtrend
- Have a buy signal/purple diamond
- Awaiting for blue candlestick to swing
- TP as projection

CORAZA may up because of divergence?Price getting lower. Possible for positive divergence take over and lead to new uptrend soon?🤔
We will know soon.
Disclaimer: Mentioned stocks are solely based on own opinions for education and/or discussion purpose only. There's no buy and/or sell recommendation. Trading involve financial risk on your own. The author shall not be responsible for any losses or lost profits resulting from investment decisions based on the use of the information contained herein.

CORAZA (Day) - still redIt yet reach bottom at this moment.
Don't try to catch the falling knife 🔪 by become daredevil to buy on RED.
Low can become lower.
Price action telling us the next move.
Especially the price fall below "sea level" (EMA line), which means it is not in favour of buyer.
Price already Red, sea water (blue cloud EMA line) unable to stop it. So, just let it red until cross over YELLOW cloud (EMA line.
Yellow merelly money 💰 💰 n Gold 🪙⭐
Wait for confirmation of reversal.
Just my way of trading 😏
Disclaimer: Mentioned stocks are solely based on own opinions for education and/or discussion purpose only. There's no buy and/or sell recommendation. Trading involve financial risk on your own. The author shall not be responsible for any losses or lost profits resulting from investment decisions based on the use of the information contained herein.

Is CORAZA Start for Another Rebound?Based on weekly chart, Coraza shows a rebound from the trendline which forming higher low. Then, todays (2/6/2023) pattern is quite the same as 21 November 2022 pattern and there maybe a possibility for the stock to move higher.

Waiting for rebound on trendlineIf price rebound away from trendline, we are looking for another long wave. TAYOR.

CORAZA: breakout DTLBreakout downtrendline + Rally base rally
Price also breaks LH 0.72.
Demand 0.655-0.7.
Lets monitor closely!
*Personal opinion trade at your own risk*

CORAZA - Heading to Wave VThe stock has likely done its wave IV correction with expanding flat pattern, and likely moving to wave V.

CORAZA - Chart Pattern AnalysisCORAZA break out Pennant Pattern with more than average volume (at the time this idea is posted)
Short term potential target price @ 0.980 (X1:X1)
Disclaimer:
This is intended to be used and must be used for technical analysis education purposes only. Trade at your own risk.

FIBO EW analysissimple extended flat correction pattern.
on weekly tf, can see it make hammer candle with extended from lowest wave A

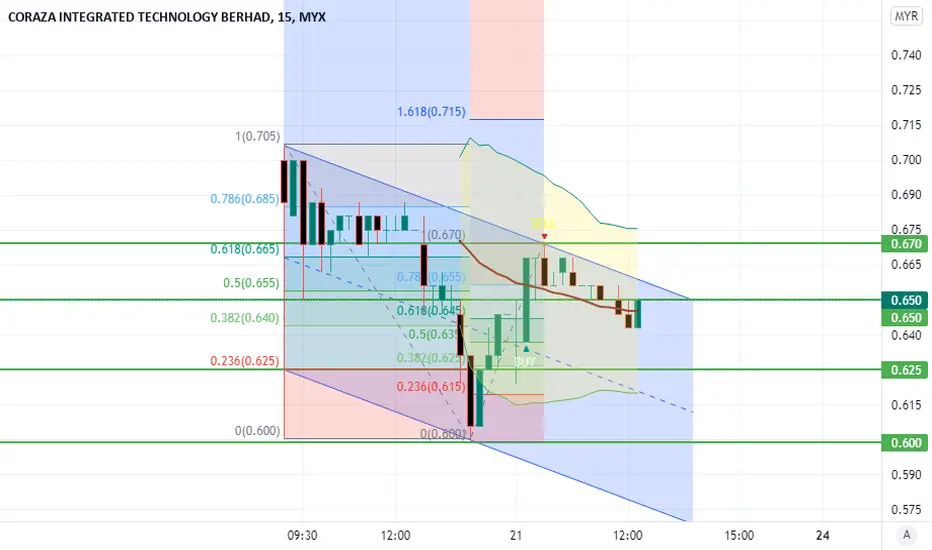
CORAZA 21/01/2022 12:30pm 15min ChartCORAZA 21/01/2022 12:30pm 15min Chart
Immediate resistance:
0.670 / 0.650
Support
0.640 / 0.625 / 0.600