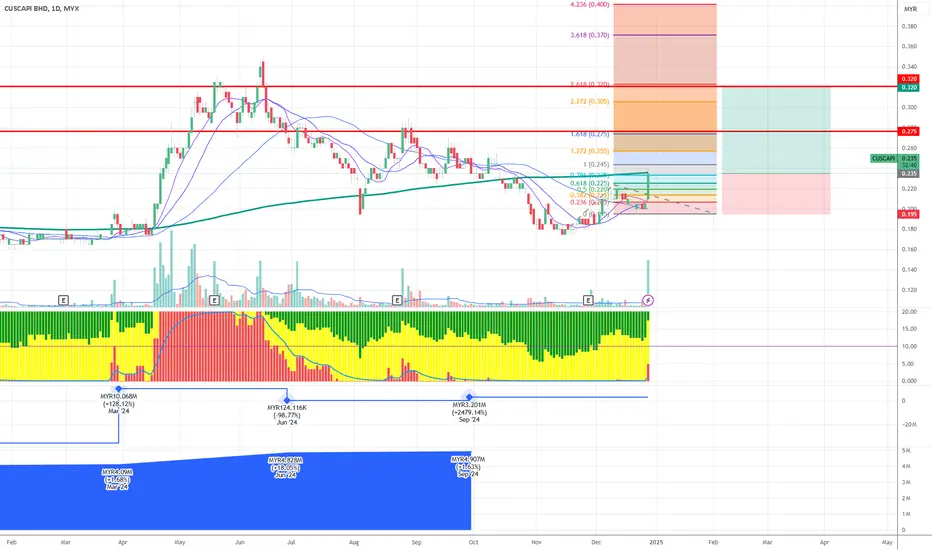
CUSCAPI will rebound starting as wave 3
Historical Movement
The stock saw a major peak around 0.370 (marked at 3.618 level)
Experienced a significant downtrend from June to September 2024
Currently showing potential consolidation and base formation
Key Technical Levels:
Resistance Levels:
Major resistance at 0.275 (marked in red)
0.010 MYR
13.38 M MYR
43.61 M MYR
597.33 M
About CUSCAPI BHD
Sector
CEO
Fang Kok Hong
Website
Headquarters
Petaling Jaya
Founded
1978
ISIN
MYQ0051OO001
FIGI
BBG000Q373M6
Cuscapi Bhd. operates as an investment holding company, which engages in the provision of restaurant management solutions. It operates through the Operational Cost Centre and Group Corporate business units. The Operational Cost Centre business unit offers support services to all the customers. The Group Corporate business unit is involved in group-level corporate services, and treasury functions. The firm also offers information technology solutions to businesses across various industries, including retail, hospitality, and automotive industries. The company was founded on November 16, 1978 and is headquartered in Petaling Jaya, Malaysia.
Related stocks
CUSCAPI - Potential target analysis for price movementN wave with E, N & NT projection.
The current price is at MYR 0.270, sitting below the Kumo, which suggests bearish momentum. The price recently attempted to break above the Kumo but was rejected, indicating the cloud is acting as a significant resistance level.
If the price breaks above the 0.285 l

CUSCAPI - PRICE MOVEMENT ANALYSISTDoes it have strong momentum to make a new 52-week high? The last trading day showed decreasing volume compared to previous days. The study uses the N wave along with the E, N, and NT targets. The price needs to break the 0.330 level to continue the rise, along with high volume. Tenkan-Sen serves as

CUSCAPI Swing Trade1. High volume break out on 20 May 2024
2. Price pull back to break out level with decreasing volume supported by 10 MA
3. Strong momentum, positive price action after earnings release, near 52 weeks high

CUSCAPI was triggered based on the MRV1 on 20 Dec 2023The CUSCAPI buy signal was triggered based on the MRV1 setup at RM0.185, with the closing price on December 20. The target is a 20% increase to RM0.225, with a stop loss of RM0.165. This is expected to take 2–3 months due to the signal being based on the daily timeframe.
The price movement pattern

CUSCAPI - Trendline breakoutPrice has broken the resistant on 17/08/2022. Let's wait for little pullback formation before placing our entry.
Would this indicates for MYX:CUSCAPI to change direction to uptrend?
Potential entry:
RM2.35 - RM2.45
Resistance:
RM2.85 / RM3.05
Support:
RM2.15 / RM2.30
Disclaimer: This trading i

A Price Breakout Signal!The candlestick indicates a price breakout signal due to significant price movement where the price closed above the MA50 line with volume above the MA20 confirming the price volume trend.
MACD and OBV also indicate a divergence signal and confirm the price uptrend towards the next price resistance

CUSCAPI EMERGING DOUBLE BOTTOMCuscapi might try to form a double bottom formation as it reached SL: 0.350 with quite high volume. Any thought about this?

Cuscapi - poised for a markupCurrent break out from trading range reminds of a past move in 2018. If the point and figure calculation is correct, the target of 65 cent coincide with Elliot wave calculation with potential 50% upside.

VCP ACTION CUSCAPINot a good fundamental company.Technically,right side of the chart showing contraction,price has been tighten up.Monitor closely for breakout above the horizontal line

See all ideas
Summarizing what the indicators are suggesting.
Oscillators
Neutral
SellBuy
Strong sellStrong buy
Strong sellSellNeutralBuyStrong buy
Oscillators
Neutral
SellBuy
Strong sellStrong buy
Strong sellSellNeutralBuyStrong buy
Summary
Neutral
SellBuy
Strong sellStrong buy
Strong sellSellNeutralBuyStrong buy
Summary
Neutral
SellBuy
Strong sellStrong buy
Strong sellSellNeutralBuyStrong buy
Summary
Neutral
SellBuy
Strong sellStrong buy
Strong sellSellNeutralBuyStrong buy
Moving Averages
Neutral
SellBuy
Strong sellStrong buy
Strong sellSellNeutralBuyStrong buy
Moving Averages
Neutral
SellBuy
Strong sellStrong buy
Strong sellSellNeutralBuyStrong buy
Displays a symbol's price movements over previous years to identify recurring trends.
Frequently Asked Questions
The current price of CUSCAPI is 0.165 MYR — it has decreased by −2.94% in the past 24 hours. Watch CUSCAPI BHD stock price performance more closely on the chart.
Depending on the exchange, the stock ticker may vary. For instance, on MYX exchange CUSCAPI BHD stocks are traded under the ticker CUSCAPI.
CUSCAPI stock hasn't changed in a week, the month change is a 3.13% rise, over the last year CUSCAPI BHD has showed a −31.25% decrease.
CUSCAPI reached its all-time high on Jan 23, 2018 with the price of 0.665 MYR, and its all-time low was 0.040 MYR and was reached on Mar 20, 2009. View more price dynamics on CUSCAPI chart.
See other stocks reaching their highest and lowest prices.
See other stocks reaching their highest and lowest prices.
CUSCAPI stock is 3.03% volatile and has beta coefficient of 2.60. Track CUSCAPI BHD stock price on the chart and check out the list of the most volatile stocks — is CUSCAPI BHD there?
Yes, you can track CUSCAPI BHD financials in yearly and quarterly reports right on TradingView.
CUSCAPI net income for the last quarter is 1.34 M MYR, while the quarter before that showed 383.80 K MYR of net income which accounts for 249.41% change. Track more CUSCAPI BHD financial stats to get the full picture.
No, CUSCAPI doesn't pay any dividends to its shareholders. But don't worry, we've prepared a list of high-dividend stocks for you.
As of Aug 2, 2025, the company has 40 employees. See our rating of the largest employees — is CUSCAPI BHD on this list?
EBITDA measures a company's operating performance, its growth signifies an improvement in the efficiency of a company. CUSCAPI BHD EBITDA is 19.36 M MYR, and current EBITDA margin is 40.28%. See more stats in CUSCAPI BHD financial statements.
Like other stocks, CUSCAPI shares are traded on stock exchanges, e.g. Nasdaq, Nyse, Euronext, and the easiest way to buy them is through an online stock broker. To do this, you need to open an account and follow a broker's procedures, then start trading. You can trade CUSCAPI BHD stock right from TradingView charts — choose your broker and connect to your account.
Investing in stocks requires a comprehensive research: you should carefully study all the available data, e.g. company's financials, related news, and its technical analysis. So CUSCAPI BHD technincal analysis shows the sell today, and its 1 week rating is sell. Since market conditions are prone to changes, it's worth looking a bit further into the future — according to the 1 month rating CUSCAPI BHD stock shows the sell signal. See more of CUSCAPI BHD technicals for a more comprehensive analysis.
If you're still not sure, try looking for inspiration in our curated watchlists.
If you're still not sure, try looking for inspiration in our curated watchlists.