DATAPRP - Analysis on price movementY wave, target (E) within stipulated time. If price keep the strong momentum, price will push upward. If break 52w high, price may reach the target.
R - 52w high
S - Tenkan Sen
Note:
1. Analysis for education purpose only
2. Trade at your own risk.
DATAPRP trade ideas

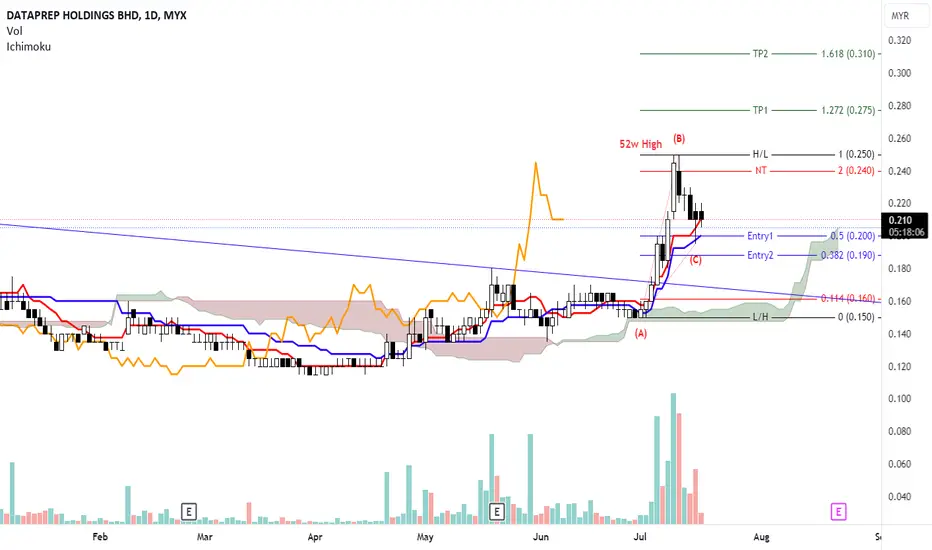
DATAPRP - Analysis on Price movementEntry & Exit strategy with fibo line as TP & SL. Price is above up Kumo, Kijun Sen & Tenkan Sen as nearest support and resistance.
N wave with NT target for the nearest target to achieve. Price need to breakout 52w High to achieve TP.
Note:
1. Analysis for education purpose.
2. Trade at your own risk.
DATAPRP - Waiting for breakoutDoes History Repeat Itself? In stock market, it happens. Dataprp currently is sitting on the strong support 0.155. Daily volume shows signs of accumulation activities while stoch RSI is hovering at the oversold region. Breakout with volume will make this counter very interesting.

DATAPRP accumulation phaseDATAPRP still below EMA 200
Accumulation phase weekly Chart
Support 0.170
Need to breakout with strong volume For next phase.

Dataprp possible long movementCan it goes back to 0.3 price, macd and BB show possiblity long movement................

DATAPRP already break the trendlineLet measure the momentum of this stock. let follow the price action


DATAPRP heading to 0.15 and expected to rally upDATAPRP is showing good potential in technical analysis. Based on my Fibonacci, its already entered the reversal zone on the monthly chart and now it is heading to the short-term reversal zone. Normally, the price will form a price action reversal pattern before its rallies. Let's wait and see the result soon.

A Breakout Signal!The candlestick body closed above the MA20 line due to significant price movement with high volume. Hence indicates a price breakout signal.
The RSI indicator showed gain momentum towards indexes 50.
MACD and OBV indicators indicate a positive price uptrend momentum towards the next price resistance.
Precaution for a price correction between 10% - 20% from the recent peak due to a short position from the traders.
To place a bid, use VWAP as a guideline and place the bid below the VWAP line.
Let's save DATAPRP in WL and watch out for significant price movement with volume support the uptrend momentum.
R 0.485
S 0.235

DATAPRP Elliot Waves updated 9/Feb/22DATAPRP by breaking RM0.70 major demand zone. DATAPRP stock price might taking longer time to complete bigger size of triangle pattern in wave (4) (cyan/light blue). Price now "seating" @ the major up trend line ( cyan/light blue dotted) if monthly price bar closed below the up trend line price may moving down toward next demand zone @ around RM0.180

DATAPRP Morning Star Formation or Continue DowntrendPossibility to form morning star, or forming same pattern as first circle or worst continue downtrend.
Entry 0.460, TP1 0.490, TP2 0.530 and cutloss 0.430. If break downtrend line, possiblity of uptrend movement. Trade at you own risk. Comment if you have different idea. Thank you for your time.

A Divergence Signal!Indicators MACD and OBV indicate a divergence signal towards an uptrend pattern. Where the candlestick price indicates a rebound from the support line with increasing volume above the MA20 line is typically viewed as a strong and healthy volume.
RSI indicates a momentum that just crosses up 30 where the possibility of increasing momentum towards 50 lines.
To place a bid, use VWAP as a guideline and place it below the VWAP line.
Precaution with price correction ~10% from its most recent peak with small volume.
Let's save DATAPRP in WL and watch out for significant price movement with volume towards the next price resistance.
R 0.715
S 0.560

A Breakout Signal!The candlestick body closed above MA20 due to significant price movement with volume confirming the price movement.
MACD and OBV charts indicate a divergence signal with a high probability of a long trend position.
The weekly chart timeframe also is in a positive uptrend. Same with MACD and OBV charts, indicate an early sign of a divergence signal.
Let put DATAPRP in the WL and watch out for price movement with volume.
R 1.110
S 0.940
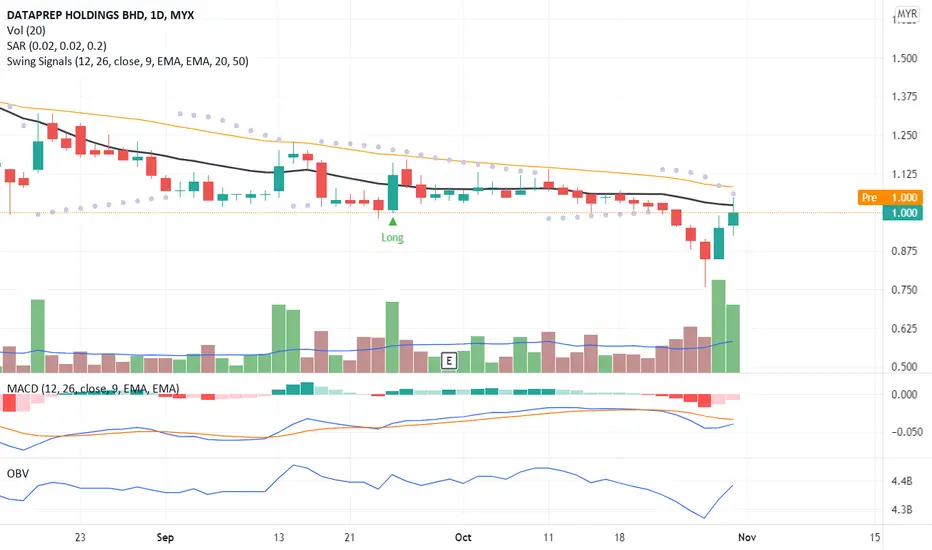
Price Rebound From MA20!The price rebound from the MA20 line without significant volume take up. MACD chart confirms the uptrend pattern and the OBV chart indicates an earlier stage of a divergence signal. Overall, DATAPRP is good for medium to long-term trade positions since it is still in the early stage of the uptrend. Put DATAPRP in WL and watch out for significant price movement with volume.
R 1.110
S 1.010

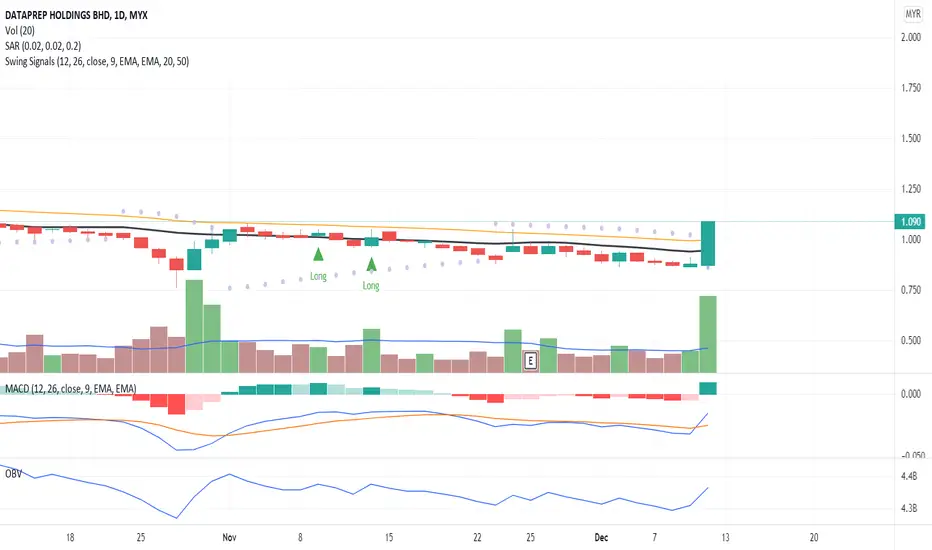
A Divergence Signal!The candlestick indicates a possibility of a divergence signal to become an uptrend pattern. Fibonacci Retracement also confirmed the divergence signal. OBV chart indicates a positive uptrend. MACD chart is still in the weakness signal probability of a divergence. The weekly timeframe is still negative and not suitable for a long trade position. Put DATAPRP in your WL and watch out for price movement above MA20 and the candlestick closed above MA20.
R 1.090
S 0.940
Dataprp need a buying pressureDATAPRP*
- PRICE ANALYSIS : 1Day Chart ( Swing )
a) Chart Pattern = 1st Degree of Major Reversal Pattern of Cup Developing support for Saucer.
b) Maximum Reversal point Fib 0.618 critical area at Saucer tip line.
c) Currently Sideway at strong support 0.980 and Red line (TRL) 1.185
d) Requirement to Breakout from MA50 and Red Line need very high buying pressure ( HIGH VR)
e) RELATIVE MOVING AVERAGE ( 10 & 20) PERFORMING APEX ( TIP) sign of bullish has come
- VOLUME ANALYSIS
a) Volume Ratio = 1.9 in good momentum for accumulation buying interest
b) VR Peak Breaking trend = Not yet sign for a new trend starter .
Trade Objective to catch breakout from strong resistance (MA50 and TRL)
TAYOR - EDUCATION POST.

DATAPRP probably at last leg up of expanding flat 31/7/21DATAPRP probably at last leg up of expanding flat which is C (Red Circled) and currently DATAPRP stock price at wave (4) (Cyan/Light Blue) which might be a bullish triangle pattern. Price might be resuming its uptrend after wave E ( yellow) completed at around RM1.135 .. while waiting to break RM4.130 which meant about 264.66% potential gain while cut lost at RM0.70 just below the major demand zone


EASY123 Prediction @MYX DATAPRPPrediction: Trend Reversal (Price stood above & support above Bull-bear divider, break 1.73 to rally.)
Target Price: R1=1.88-1.91, R2=2.20-2.22, R3=2.38-2.44
Support/Cut Loss: S1=1.40-1.37, S2=1.11-1.10
Signals & Analysis:
*Candle has turned from Red to Blue color on 08-Jul, an indication of a trend reversal.
*Price crossed above the Bull-Bear Divider (Redline) & turn the resistance become support.
*After the rallies, the consecutive correction contraction was observed.
*Heat volume signal detected on 6/7-Jul, indication present of "Big Player"
Signal's Interpretation:
ENTRY Signal:-
*Blue-Candle = Market at Uptrend sentiment.
*Candle color changed from RED to BLUE & Candle closed "ABOVE" the Bull/Bear Divider (Redline).
*🔶BT-Yellow-Diamond = Bottom reversal signal.
*🔵🟢🟡Blue/Green/Yellow-Dot = U-Turn entry point signal.
*🔔Yellow-Bell (on top of the candle) = Strong momentum, potential rally actions.
*🔼White-triangle = Strong momentum exists, potential rally action.
EXIT Signal:-
*Red-Candle = Market at Downtrend sentiment.
*Candle color changed from BLUE to RED & Candle closed "BELOW" the Bull/Bear Divider (Redline)
*🔴🔵Red/Blue-Dot (on top of the candle) = Potentially a Top signal.
*Disclaimer: This is not a Buy or Sell suggestion but solely sharing the information...Trade at your own risk.
*Preference Strategy: Swing trading (Follow the ENTRY/EXIT Signal respectively).
*Reminder TP & CL is an individual preference & decision. No fixed rules or guidelines for it.

DATAPRP probarly forming a triangle. 4/July/21DATAPRP probably is forming a triangle in wave B ( Red Circled).. As Price ranging above the major demand zone

DATAPRP: Got hope?If cannot hold support, it will be heading all the way south.
S1: 1.290/1.280
S2: 1.270/1.260
R1: 1.390/1.400
R2: 1.460/1.480


