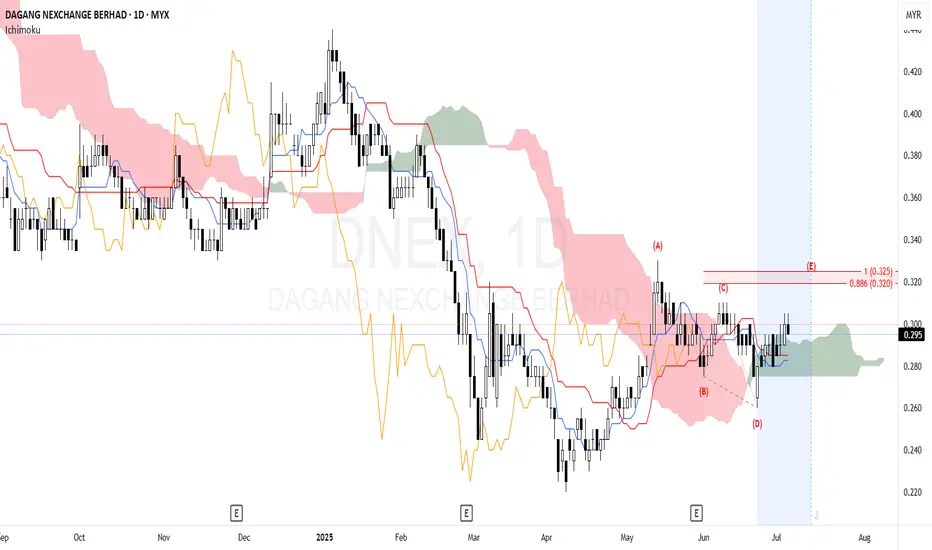
DNEX - Looking for bullish continuationP wave with target (E) within stipulated time.
The last traded price is around 0.296.
The price has recently moved above the Kumo. This suggests a potential shift towards a bullish sentiment or at least a consolidation phase above the previous resistance.
The Chikou Span is above the price action of 26 periods ago and is also above the Kumo, which is a bullish signal.
After a downtrend from early 2025, the stock found support around RM 0.230 in April. Since then, it has been attempting a recovery, forming what appears to be a potential inverse head and shoulders pattern or at least a base. The stock has pulled back slightly and is currently consolidating above the Kumo.
Immediate resistance at. If price can be maintained above this level, it may achieve the target (E) 0.320-0.325.
Immediate support is provided by the top of the Kumo and Tenkan Sen, currently around 0.285 - 0.290. Stronger support is seen at the bottom of the cloud and the previous swing low around 0.270.
Overall Trend:
Long-term: Bearish, but showing signs of bottoming out and attempting a reversal.
Medium-term: Neutral to slightly bullish, as the price is above the Kumo and the Chikou Span is strong.
Short-term: Consolidating with a bullish bias, provided it stays above the Kumo.
Entry Strategy:
Aggressive Entry: Consider an entry on a rebound from the current support area (top of Kumo/Kijun-sen) around 0.290 - 0.295, with confirmation of bullish candlestick patterns.
Conservative Entry: Wait for a confirmed breakout above the strong resistance at 0.325. A strong close above this level, ideally with increased volume, would be a more reliable entry signal.
Stop-Loss:
For Aggressive Entry: Place stop-loss below the bottom of the Kumo, perhaps around 0.265 - 0.270. A close below this level would negate the current bullish setup.
For Conservative Entry (after 0.325 breakout): Place stop-loss below the breakout level, perhaps around 0.310 or below the Kijun-sen if it starts to flatten/rise with the price.
Note:
1. Analysis for education purpose only.
2. Trade at your own risk.
DNEX trade ideas

Dnex Impulsive move complete?Daily chart show an impulsive upward movement, if this movement is valid signal for uptrend. Anticipate 50% retracement with 1:2 risk reward ratio. Stop loss below current low.

DNEX- "Last Dance Bottom"W pattern + Fibo prediction as per chart on Daily timeframe.Base on technical analysis it would become to turn Bullish Factor.

DNEXAlgo TradingSystem by Remisier CheDin
The current market conditions, as identified by my algorithmic system, indicate potential upward signals. These signals include increased trading volume, an upward trend with prices above the EMA20 and EMA50. Consequently, the present conditions suggest a possible upward trend.
It's crucial to remember that trading strategies account for only 10-20% of your overall trading success. The majority of your success depends on effective risk management. This involves having a well-defined trading plan and appropriate position sizing, which are essential for maintaining the right trading psychology. Master your risk management and trade according to your plan.

DNEX, potential bullish reversal based on AlgoSignal StrategyThe current point exhibits upward signals according to my algorithmic system, meeting various criteria.

DNEX 6.6.23 Analysis Potential For LongDNEX has been pushed as high as 0.52. On 6.6.23, correction is happening. Low risk Traders can wait at reverse fib level 0.5 at price 0.445 or 0.382 at price 0.425. High Risk traders can enter from range price 0.48 or 0.49 if price momentum maintain above 0.48.
TP target price 0.615.
Good luck traders.

DNEX is forming running flat ABC (Red Circled). 15/May/23DNEX is forming a running flat ABC ( Red Circled) where it will find its major support @ 0.20 +/-.

DNEX. Elliottwave updated 18/Nov/22DNEX probably completed its zigzag correction ABC ( Red Circled).

Dnex - Double BottomMYX:DNEX
Stop: 0.71
Resistance: 0.9
Price bounced off after testing 0.71 with low volume suggesting that sell-off is has peaked. With recent upward trend, double bottom formed.
Additional volume will possibly propel prices higher.


DNEX - Continuous patternPrice has gone uptrend since the last time it broke the trendline on 20/07/2022.
We are expecting short retracement before it continues another rallies for DNEX.
Potential entry:
1) RM0.78 - RM0.80
2) RM0.76 - RM0.77 (Best entry for long-term)
Resistance:
RM0.86 / RM0.91
Support:
RM0.725
Disclaimer: This trading idea is for education purpose only. This is not a buy call nor a stock recommendation. Please trade at your own responsibility.

DNEX elliottwave analysis. 28/July/22.DNEX a Piotroski F-Sore 8 out of 10 ( fundamentally “good” ) company. Possible forming a running flat pattern ABC ( yellow) where price possible resuming its uptrend ONLY @ around RM0.55 - RM0.56..

DNEX on spotted in volatility reversal at EW ABC corrective zoneDNEX spotted in volatility reversal above its daily PoC. Dnex has also completed the EW ABC corrective zone's 5 sequence. If seen in weekly chart, DNEX has rebounded slightly above fibo50 and also from the monthly PoC. Quick exit at 0760 if price goes south. TP levels at fibo levels in daily chart.


DNEXOpen position: 1
Close position: 1~6%
SL depends on your risk-reward ratio
#DeepagiScreener #TAYOR #buylowsellhigh #swing

DNEX@ 14.4.2022 (12 Ramadhan 1443)
TFD candle narrow down to create triangle pattern
#learningprocess
#notbuycall

dnex 8422some one can tell me the story behind this chart
waht is the price gonna to do.
where the best entry
where to CL
why CL..because CL means how u manage ue MM.
SAlam jumaat.
PLS COMMENT BELOW

DNEX Analysis(28 MARCH 2022)look like we have to wait for a confirmation,not good time to invest because it look risky for now.
Disclaimers:-
I AM NOT A FINANCIAL ADVISOR,EVERYTHING I SHARE IS JUST MY OPINION.
Sorry my english bad,at least im trying pfftt!

dnex at 618 retracementNEX can try now at 618 retracement. CL as per trailing ATR and TP at pivot point.

DNEX DAGANG NEXCHANGE BHD 4456 analysis bursa saham MalaysiaShort term analysis:
Dnex breaks above trendline again after 4-days of pullback from 11-Jan.
Today indicator Banker Chip Pro (MI04) appears Banker Pump (purple bar) indicates possible of continuous bullish trend, but beware of overbought reversal.
It will be a plus sign if indicator Long Short Momentum (MI06) keep in Green bar showing still under bullish trend.
#bursasaham #malaysiastockmarket #dnex #dagangnexchange #4456 #bursamalaysia #malaysia #bursa
#trendline #trendanalysis #technicalanalysis #chartpattern #trendpattern #uptrend #shortterm
#supportresistance #technicalindicator #indicator #waveanalysis
Disclaimer:
This published Idea is solely for the purpose of education and opinion sharing, and should not be construed as investment advice or recommendations to buy or sell any security.
Get your trade advise from a legit broker, you are responsible on your own trade.
