DUFU - Small spinning tops after a large bearish candle ?DUFU - CURRENT PRICE : RM1.33
DUFU is in a downtrend as the highs and lows are getting lower since JULY 2024.
However, I expect that the bottom may reached since there was a small spinning tops candle appear after a large bearish candle. This spinning tops candle session was traded in high volume indicating that buyers are strong enough to overcome selling pressure.
I would aggressively buy if price the share price moves above the spinning tops real body. In this case, if the share price moves above RM1.34 , I would buy on price RM1.35 - RM1.40.
Target price will be RM1.49 (the high of large bearish candle) and RM1.58. At this level, my stop loss will be the low of the spinning tops candle - RM1.29. This scenario gives an attractive RISK to REWARD ratio.
Then if the stock manages to move above RM1.58 , I would reentry and set a target price of RM1.70. At this point, my stop loss will be RM1.49.
ENTRY PRICE : RM1.35 - RM1.40
TARGET PRICE : RM1.49 and RM1.58
STOP LOSS : RM1.29
If price breaks above RM1.58 , then reentry.
ENTRY PRICE : RM1.59
TARGET PRICE : RM1.70
STOP LOSS : RM1.49
TAYOR !
DUFU trade ideas

DUFU Double Bottom, BullishTime Frame: 4H
Sentiment: Overbought
Forecast: Bullish
We can see a strong support and buying momentum around 1.6-1.8, selling power is weak.
Bar price action and the volume, showing buyers' power increase.
Broke the resistant level 1.86.
Heading to 2.13 & the next resistant around 2.2 - 2.4.
Write your thought in the comment session :)
P.S
Please, note that an oversold/overbought condition can last for a long time, and therefore being oversold/overbought doesn't mean a price rally will come soon, or at all.
Like my works? Please hit the Like, Follow and Share or tip me a coin :)
Thanks!
Disclaimer
This information only serves as study references, does not constitute a buy or sell call.

Starting to Accumulate DUFU StockDUFU recently reported a profit loss of RM 3.2M in its latest quarterly report. The main reason for this drop was a forex loss, which I believe is a short-term issue and doesn’t reflect DUFU’s core business health.
Looking at some key financial data:
Operating Income: Increased by 26.05% quarter-over-quarter, breaking its downtrend.
Total Assets: Holding strong at over RM 400M (close to its peak of RM 447M).
Free Cash Flow: RM 17.39M, which is solid and near its highest level of RM 18.66M.
From these numbers, I don’t see any major concerns with DUFU’s fundamentals. If we believe DUFU can improve in the next quarter, accumulating the stock between RM 1.6 to RM 1.75 seems like a fair entry range.
Disclaimer:
This is for informational purposes only and not a recommendation to buy or sell. Always do your own research and consider your financial situation before investing.
MYX:DUFU

DUFU, might be a chance for bounce back / continuationThe current point exhibits promising upward signals according to my algorithmic system, meeting various criteria. These include rising trading volume, an upward trend indicated by prices above EMA20 and EMA50, and the closing price surpassing VWAP. As a result, the present conditions suggest a potential upward trend.

DUFU SWING TRADE SETUP1. High volume break into 52 week new high on 12 April 2024
2. Price supported by previous resistance and 10 MA
3. VCP setup
Buy if price break above downtrend line with volume

DUFU, potential reversalThe current point exhibits show upward signals according to my algorithmic system, meeting various criteria. These include rising trading volume, an upward trend indicated by prices above EMA20 and EMA50, and the closing price surpassing VWAP. As a result, the present conditions suggest a potential upward trend.


DUFU TECHNICAL ANALYSISTechnical analysis for DUFU Stock based on Trend Analysis, Chart Pattern and VPA
1) In Monthly TF
- Overall trend still maintaining the long term UTL with price candle stay above MA 200 line.
- Current monthly trend had retracement and rebound at Fibonacci 0.382 area considered neutral retracement in a healthy trend.
- Latest OCT 21 monthly candle shows a solid Bullish candle accompany by significance volume higher then previous volume signal indicate demand coming in give possibility reversal to occur.
2) In Weekly TF
- Overall trend still maintaining the long term UTL
- Current weekly price candle trend moves upward accompany by increasing volume validate the bullish movement. Uptrend Channel Pattern occur in current trend.
- Latest 8 NOV 21 Weekly candle show a solid Bearish candle with short upper wick accompany by significance volume validate the price action and signal significance selling pressure occur in the market. Price may move lower in the following week within uptrend channel line to remove remaining seller.
3) In Daily TF
- Overall trend still maintaining the immediate support line and the formation of Uptrend Channel Pattern to occur with highest VAP at price 4.390-4.425 within the Uptrend Channel. High volume in VAP occur for price within Uptrend Channel.
- Current daily price candle trend is retraced after completing the Head and Shoulder Pattern and rebound at Fibonacci 0.382 area are considered neutral retracements in healthy trend. Latest price candle move upward and forming a Uptrend Channel Pattern with strongest buying volume from VAP is at price 4.255-4.290-indicate strong support/demand area.
- Latest 16 NOV 21 candle give a solid Bullish candle accompany by significance volume validate the price action. Buyer coming in and the price may move upward along Uptrend Channel.

dufujust simple idea
price analysis based on market structure
using trend line
plan ur trade wisely
TAYOR

VCP SETUP DUFUStrong fundamental base.Currently forming VCP setup base.Look for upward breakout with high volume to confirm setup

DUFU TECHNICAL ANALYSISTechnical Analysis for DUFU based on Trend Analysis, Chart Pattern and Fibonacci Retracement


DUFU - Pending BODUFU
Theme: Tech
Rst: 4.54
Spp: 4.23
Neutralising triple top formation as well pending for C&H BO, strong trend is there to support the push


Trend Rider 81. Break trendline, Wave 3 formed and retraced at .382 (also RBS), and rebounced.
2. Weekly uptrend, EMA 12 > EMA36 > EMA 200.
3. Bursa Marketplace rating 7 (strong fund and mom), isaham 10.6, i3 no ATP.


DUFUDUFU
SECT : TECH
TREND :
MEGA TREND : UPTREND
EPS : 9.6800
P/E : 19.76
ROE : 1.16
NTA : 0.4900
SOURCE : KLSE SCREENER
DISCLAIMER. BUKAN BUY CALL. SARANAN BELI OR WHAT SO EVER. DUFU TRYING TO BREAKOUT, TO MAKE A NEW HIGH. GOOD FUNDAMENTAL.

Monitor price close above 4.34Price rebound from EMA7 (dynamic support) and close above R1. If price close above 4.34, TP = 4.46 / 4.61.
TF: 2-4 weeks.
Disclaimer: TAYOR.

DUFU - Pre Consolidation BreakoutPre Consolidation Breakout Setup.
NO INVESTMENT ADVICE IS PROVIDED
DISCLAIMER
Please consider your own interpretation of Opportunity & Risk. The author of this post strictly follows the Malaysian Security Commission ( SC ) Guidelines on the prohibition of Investment Advice by unlicensed parties. Any examples shall use historical charts without any recommendations and not to cause inducement to the public to take action or position (e.g. buy, sell or hold) regarding a particular class, sector, or instrument in relation to securities or derivatives. The author will never provide any investment or trading advice as the activity of giving investment advice is likely to be considered as a regulated activity under the Capital Markets and Services Act 2007 ( CMSA ). All posts made in Tradingview do not include any communications involving providing recommendations or opinions or includes any material, content or any statement which are likely to induce a person to take any action or position (e.g. buy, sell or hold) regarding a particular class, sector, or instrument in relation to securities or derivatives that is likely to be considered as “advising others concerning securities or derivatives”. The author will not recklessly make any statement, promise or forecast that is misleading, false or deceptive to induce or attempt to induce another person to deal in securities or derivatives. None of information posted in post can be used as investment decisions. Do not trade solely on the information posted. Trade at your own risk and judgement. A trader could potentially lose all money. Only risk capital that can be lost without jeopardizing ones financial security of lifestyle. Please seek licensed professional guidance if you plan to invest your capital seriously.

DUFU TURN UPTRENDMYX:DUFU
EMA 20 CROSS EMA50
FiFT +VE
MCDX BANKER MOVING AVERAGE CROSS UP RETAIL MOVING AVERAGE
ATOM ABOVE RIVER

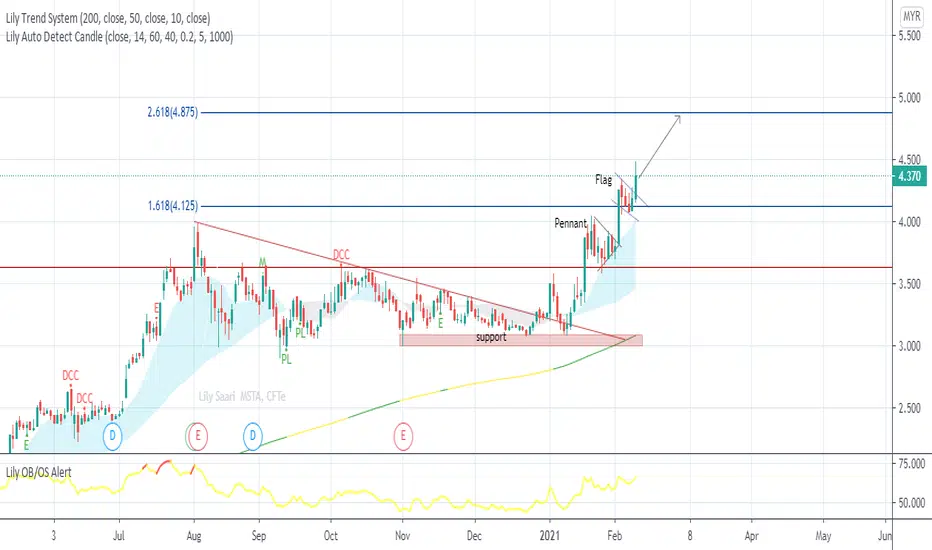
Hit TP1, remains Bullish for TP2DUFU has recently moving above Resistance turns Support at 4.125 and we notice a Flag pattern above the support level. We will see movement to the upside continue to unfold towards 4.87.
Disclaimer: Our content is intended to be used and must be used for technical analysis education purposes only.
Bullish BreakoutThere was a significant upside move above a valid downtrend line. The share is likely to rise further to 4.125 if it could break ATH at 3.98. On the flipside, if the price close below support zone at 3.10 the implication will be bearish.
Disclaimer: Our content is intended to be used and must be used for technical analysis education purposes only.
