Eastern & Oriental Bhd - Potential Bullish Reversal Pattern# Technical Analysis: Eastern & Oriental Bhd (E&O) - Potential Bullish Reversal Pattern
Looking at the E&O chart (ID: MYX), I can see that the stock is currently trading at 0.845 MYR, up 0.030 (+3.68%). The chart shows several key technical patterns and trade setups:
## Current Position Analysis
- Trading near support at 0.845 MYR
- Open position: 2,105 shares
- Target price: 1.105 MYR (+30.18%)
- Stop loss: 0.755 MYR (-11.24%)
- Risk/Reward ratio: 2.68 (favorable)
## Technical Indicators
The price action is currently showing signs of a potential reversal, with:
1. Multiple moving averages beginning to flatten and potentially cross
2. Price testing a horizontal support zone (highlighted in blue)
3. Recent bounce from support with increased volume
## Long-Term Perspective
The chart displays a complete market cycle from 2023-2025:
- Strong uptrend through late 2023 into early 2024
- Distribution phase in March-April 2024
- Downtrend through mid-2024
- Current consolidation/potential accumulation phase
## Trading Signals
Several key sell signals were triggered at the top, with more recent buy signals appearing near support. The drawn trendlines suggest a large descending triangle that may be resolving to the upside if support holds.
## Outlook
The current setup appears to be forming a potential inverse head and shoulders pattern with:
1. Left shoulder (October-November 2024)
2. Head (December 2024-January 2025)
3. Right shoulder forming now (February-March 2025)
If price breaks above the neckline with increased volume, the measured move target of 1.10 MYR appears reasonable, aligned with the charted target price of 1.105 MYR.
E&O trade ideas

TECHNICAL ANALYSIS - E&OTechnical analysis based on Elliot Wave + Moving Average. Elliot wave to provide analysis on current wave and anticipate next wave.

E&O - Looking for strong bullish sentimentP wave
The breakout point (Entry on B/O) is marked at 0.965, indicating the breakout from the P Wave.
Confirmed by the volume spikes, especially in the latest breakout, which indicates strong interest.
The price is above the Kumo, indicating bullish momentum.
Chikou Span is above the price, confirming bullish bias.
Tenkan-sen is above the Kijun-sen, further affirming bullish momentum.
Entry on breakout above 0.980 with close monitoring of volume to confirm the strength of the breakout.
Analyze the broader market sentiment or sectoral trends. Bullish sentiment will increase the likelihood of the breakout holding.
Note:
1. Analysis for education purposes only.
2. Trade at your own risk


E&OThis Week FORECAST
Opportunity for E&O. This setup trading idea is for intraday. >> TAYOR
Risk Factors:
1. Market conditions, unexpected news, or external events could impact the trade.
2. Always use risk management strategies to protect your capital.

E&O TIme Frame DailyE&O TIme Frame Daily
Hai Traders
Interesting to note
Only suitable for long term
Already breakout above RBS
Waiting retract until for the best price
#thisonlyforpredectionstudy
#thisnotforbuycallorbuysell
#chartpattern
#TAYOR
#MFM.TRADER

E&O Break TrendlineE&O Daily
Hai traders..Nice movement already breakout trendline
And now going to complete wave
No need to buy on shoots
#thisonlyforpredectionstudy
#thisnotforbuycallorbuysell
#chartpattern
#TAYOR
#MFM.TRADER

E&O is Expected Going to 1.618 Fibo Extension in Next MoveThe price is expected to retrace from 0.618 before continue projection to Fibonacci extension 1.618
This is for fundamental reference only and not a buy call.


E&O - Weak QR, U Turn Soon?E&O
Theme: Property
Rst: 0.785
Spp: 0.725
Strongly supported by Fibo Ext 50 - 61.8% as we can observe flush below this area is constantly pushed back by buying pressure. Shall consist space to push towards MA200 of weekly chart


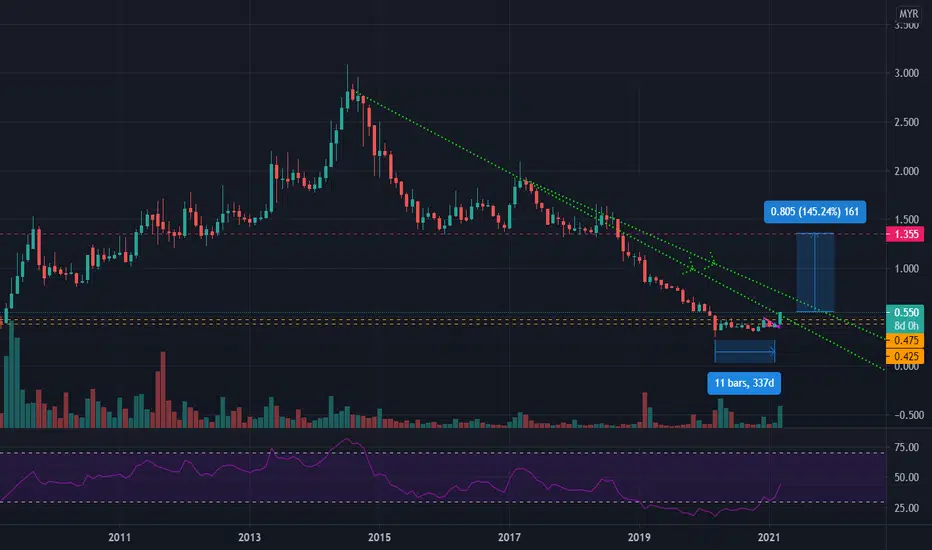
Time to awake?There are several reasons why picking this stock.
Fundamental analyzing it, I dont think this is the best in property sector, but if the worst is over, then this is the undervalued company.
As this stock in in property sector, it is a sector not to be missed, although it grows pretty slow.
Moreover, this stock has been sideways for 337days. Which I think the lowest price has come to limit.
It has 2 green gradient to beat, the first steepest gradient is successfully break, following by 2nd one.
Once these gradients are broken, hoola. Bottom Flat breakout.
This stock may not skyrocketing, but the risk is far lower, just that it takes much more time to have the trend changed.


E&O, jump out from the deep seaAfter the Lagenda jump out from freezer, this E&O also jump out from deep sea.
PM me if you want to know more info about this stock.

{SWC}--E&O, W-Shaped Bottom Forming?Thank you for your continued support ! :)
Strategy: Candlestick Bullish Chart Pattern Formation
E&O, Breakout with volume today, will this momentum can keep going? We don't know, let the market decides. However, E&O breakout from short term downtrend line and forming double bottom (W-shaped) chart pattern. If the formation has to be done, neckline at RM0.635 should be the next direction E&O go with immediate support at RM0.595.
Support: 0.595, 0.570
Resistance: 0.635, 0.670

E&O - Pullback in Downtrend1. Opportunity to trade in short term
2. Sell-Off at the background
3. Short accumulation with strength (better use hourly chart)
Send us your preference stock to review based on TradeVSA chart by comment at below.
Disclaimer
This information only serves as reference information and does not constitute a buy or sell call. Conduct your own research and assessment before deciding to buy or sell any stock
