ECOWLD - Heading towards 52 WEEK HIGH ?ECOWLD - CURRENT PRICE : RM2.00
ECOWLD broke out a 6 month down trendline on 01 JULY 2025 with high trading volume indicating strong bullish momentum. The stock is bullish as the price is above both 50 and 200 EMAs. Furthermore the share price is near 52 Week High. RSI is above 50 and below 70 indicating stock is bullish and not considered overbought yet. Nearest target will be RM2.16 (52 Week High resistance) and then if the trend resume, it may propel higher to hit next target at RM2.28. Support level is the low of 23 JUNE 2025 candle - RM1.77.
ENTRY PRICE : RM1.99 - RM2.02
TARGET : RM2.16 and RM2.28
SUPPORT : RM1.77
Notes : On 26 JUNE 2025 the company announced its increasing QUARTERLY EARNINGS. May visit company website or TheEdge for get more information.
ECOWLD trade ideas

ECOWLD Three White SoldiersBased on the chart, the price close higher with high volume. Not only that, the stochRSI are consolidating within oversold region which is between 6% to 31%. Moreover, the today's stochRSI has cross up the 20% level and there is more room before reaching overbought.

ECOWLD Price/Volume SETUPHave been 6 months since my last update. Off for fishing when market is not good.
Lately start to screen back and observed ECOWLD with healthy price and volume action. Stocks entered Stage 2 since March.
Disclaimer:
Information presented here is not intended to be used as the sole basis of any investment decisions nor should it be construed as advice designed to meet the investment need of any investor. Trade at your own risk.
Low risk ~6% with MA50 as support. Let's see.

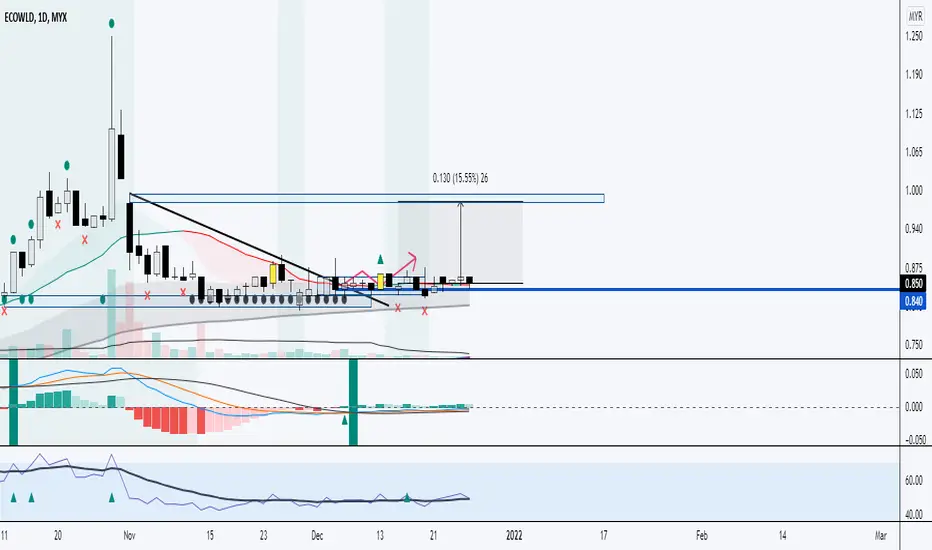
ECOWLD standing strongMYX:ECOWLD is standing really strong around 0.825 area and looks to be well supported.
Targeting another wave up in this name.Target around 0.86 while stops are 0.785 for a 1.5:1 RR trade.
These are my views and analysis and is only used for educational purposes. I am not a financial advisor.
Nothing in the information posted here is intended to be or should be interpreted as trading advice.


ECOWLD 8/6/2023This is not a buycall!
Seems like Continue Uptrend for MYX:ECOWLD
EP : 0755/0760
CL : 0730/0725
TP : 0795/0800 ( FIRST TP) will pullback after touch 0800
BD : 6/6/2023
Daily : Uptrend
Weekly : Uptrend
Waiting Period : 20 days.. kalau price x gerak.. cabut
maybe cup and handle chart.. TP RM 1

Ready to rm1Downtrend to sideway ,and now it ready to breakout key zone 0.705 ~0.730 . And the support zone will be 0.620 -0.615. if the price going to test the resistance and breakout it will be become big uptrend . Pls hold tight enjoy the trend . Estimate profit 45% above .

Ecowld: Early mark up phase?Phase: Short accumulation complete. Likely early mark up.
Favourable risk to reward ratio if we can enter close to RM1.00.
The target price was calculated using point & figure chart.

KLSE : Precise Rebound Analysis with 5 mins chartTo time a perfect rebound for trading, common technical analysis is not going to help much. Due to the signal is always late, causes our entry at the high price & price fall after that.
Common technical analysis often use average price & volume for indicator or price up with high volume , which the big boys often use this method to attract investors attention for them to take profit.
If we want to make rebound trade or find the bottom of the price, we need to know WHEN will the big boys markup the price & WHAT kind of price movement the big boys will transact before the markup.
We find price bottom very different from the traditional analysis, we don't use support line, indicators, nor candlestick pattern. We use a more effective analysis to find the price bottom, by looking at 5 mins chart.
Below explanation is 1 of our previous trade in ECOWLD, which we have taken the profit after that.
Kindly zoom in to 21st OCT & 25 OCT for visual explanation.
*we are not allow to insert image link because we haven't got enough of reputation point*
On 21st OCT we can see the 5 mins chart have volume created with price maintaining at the high price. This shows the big boys have intention to markup price the next day.
That's where we enter the trade on 25th morning ant take profit on 27th before the price down.
Stock price move according to the big boys expectation & every price moves have an intention to attract buyers attention with price mark up.
Big Boys will sell fraction of their shares for profit when there are enough retail investors place buy orders at the lower price. That's the reason for price retrace in an uptrend.
Big boys in KLSE often have this price movement before any short term rebound. By understanding the big boys operation style, we will know the next day price movement before the price fall or up.

ECOWLD in Bullish Flag FormationCan try ECOWLD spotted rebounding from 52-week low in bullish flag formation and at Elliott Waves' ABC corrective zone. CL below 52-week low and TP at any of the fibo levels above.

Cup and handle pattern and retrace with low volumeMight be formed a cup and handle pattern
Buy now or wait for breakout
Retrace with low volume
TP: 1.060
SL: 0.835

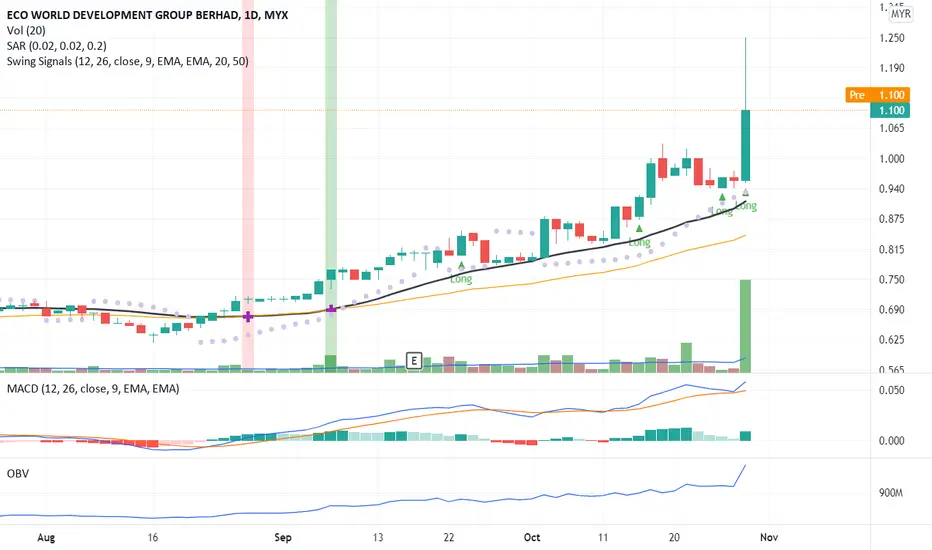
LOW CHEAT SETUP ECOWLDRecent quarter report improving sales and profit.Price just break above horizontal line with high volume.
note : ive been posted the counter before this (13/9/2021) .A huge gain profit has been made.u can check it out.Hopefully this is the second oppurtunity.

<TradeVSA> Daily TradeVSA Stock Ideas - 20 JanSign of Strength in the chart:
1. Reaccumulation / Reversal with Hidden Potential Buying
2. Green Pentagon with market stages in uptrend
Stock to Focus:
1. DAYANG
2. ECOWLD
Disclaimer
This information only serves as reference information and does not constitute a buy or sell call. Conduct your own research and assessment before deciding to buy or sell any stock

MONITOR BO VCPMONITOR for 1 week.
last night berkira-kira nak masuk ke tak sebab ADR<3%.
nampaknya volattility low at that particular time because there's now buy and sell process.
the lower the ADR, means could be no supplier at Pivot point.
Extrapolate volume is number 1 for confirmation.

Backtest Trade 3.0: ECOWLDMake setup when have these policies:
1) extrapolate volume (than pocket pivot & 20MA line)
2) ADR = 4.274% > 3% =strong momentum
3) candle bullish
4) above 200EMA (blue color)
5) entry by refer to lower TF, as have upper wick
6) TP based on sign. Resistance zone

ECOWLDGOODLUCK TRADERS
TRADE AT YOUR OWN RISK
buy at the support will be recommended!!!
“Compound interest is the eighth wonder of the world. He who understands it, earns it. He who doesn’t, pays it.” — Albert Einstein
JUST MY OPINION!
NOT A FINANCIAL ADVISE!!

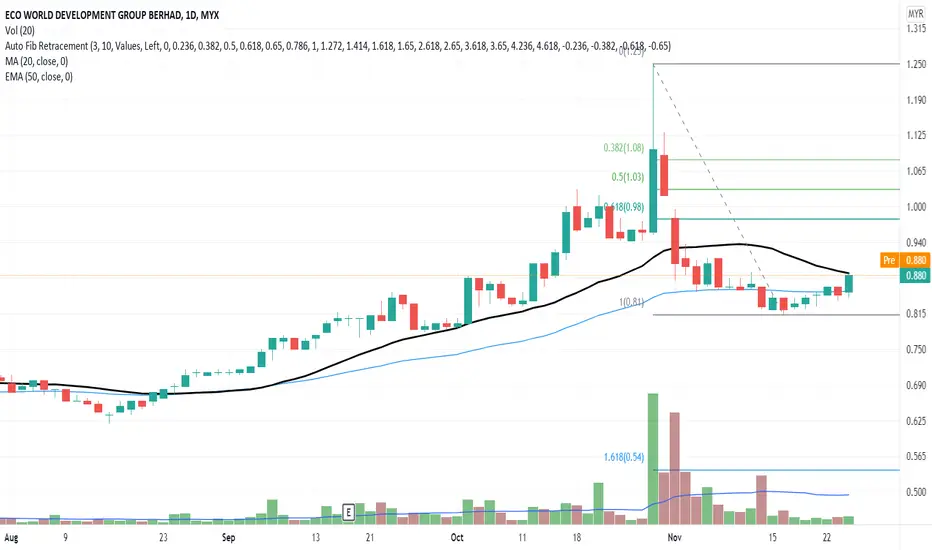
ECOWLD IN ABC FORMATIONPoint A: swing low at 0.620.
Point B: swing high and 52-week high at 1.250
Point C: bullish impulse pullback at 0.820 (also EMA100). Price is consolidating between EMA100 and daily pivot point 0.850, where in the middle of the price range is yearly pivot 0.850.
Current price at 0.860 is fibo618.
Probable EP: 0.850 to retest a yearly support.
Probable TP: 1.080 yearly resistance, R2 and fibo236.
Probable CL: 0.785, i.e., below yearly support.

Uptrend Pattern After Rebounce From Support Line!Using Fibonacci Retracement (FIBO) chart, the price indicates a continuous price uptrend momentum from the support line.
MACD and OBV charts indicate an early sign of divergence signal.
Therefore, it is in a good position to buy since it is below-the-market order and waits for the next significant price movement. Hence minimum the exposure risk from buying at peak price.
Put ECOWLD to your WL and watch out for significant price movement with volume or after the candlestick body crosses the MA20 line.
R 0.885
S 0.840
ECOWLD strong counter3 historical rebound at 100 EMA. Buy in at 100 EMA around 0.8 and should be heading to bullish.

ECOWLD - On its OWN world (PART 2)1st Trading Ideas : SUCCESS (ROI 28.7%) - refer link
2nd Trading Ideas : We see whether have another round of possible luck or not..
Trading Strategy:
1) 1st Entry: Entry at the breakout level zone
2) 2nd Entry: Entry at the averaging zone
3) CL Level specified.
I am nubis, i am non-premium members ..follow if you think this idea make sense..just sit back, relax and make some money.
-Heil_Z-
# Are-snuff Traders Club
# Bilis Traders Group

A Breakout Signal!More breakout signals for ECOWLD after significant price movement due to high demand. MACD and OBV charts confirm the uptrend pattern. Will ECOWLD be able to continue the price momentum or have a price correction on today's trade? Put in your WL and watch out for more price movement with volume.
R 1.25
S 1.00
ECOWLD FALLBACKFound Bearish Butterfly Pattern at Fibo extension around 1.27%.
My expectation price will retrace first to 0.382% .
#TAYOR MYX:ECOWLD
