EG INDUSTRIES - POTENTIAL BULLISH CONTINUATION PATTERN ?EG INDUSTRIES - CURRENT PRICE : RM2.03
In long term the stock is UPTREND as the share price is above 200-day EMA. For short and medium term, the stock is trading in sideways. However, based on chart pattern analysis, the stock is potential of making BULLISH ASCENDING TRIANGLE - Bullish Continuation Pattern .
Based on ICHIMOKU CLOUD, the share price is trading above CLOUD indicates a little bit bullish scenario. CHIKOU SPAN is in CLOUD and pending to breakout above cloud. If CHIKOU SPAN manage to break above CLOUD, it will add more bullish outlook for the stock and technically it is a buy signal.
At current moment, if the stock made a high above RM2.05, then technically it is a buy signal for me based on CHART PATTERN (Completion of ASCENDING TRIANGLE) and ICHIMOKU CLOUD (CHIKOU SPAN breakout CLOUD).
ENTRY PRICE : RM2.06 - RM2.10
TARGET PRICE : RM2.22 and RM2.37
SUPPORT : 50-day EMA
EG trade ideas

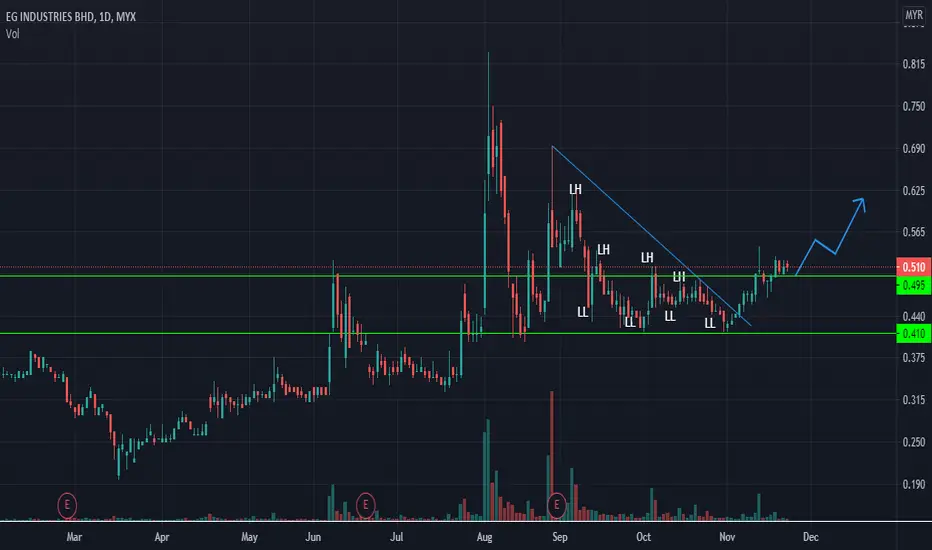
Still in Down TrendI will only trade this counter when the Trendline is broken with a big candle + high volume.
The price must be above EMAs 20 - 50 - 200 before it goes into my Watchlist.

EG ReboundBased on the chart, the price rebound from MA50 and almost cross above EMA21. Not only that, StochasticRSI cross above the oversold region. Moreover, on the weekly chart, the price is above the support level 1.47 and there is a possibility to make a higher low.

A Breakout Signal!With significant price movement from the previous trade, the candlestick indicates a breakout signal where the price closed above the MA200 line backed by high volume due to buying interest.
MACD and OBV indicate a divergence signal and confirm the price uptrend towards the next price resistance.
Precaution since RSI is at indexer 70; becoming overbought or overvalued. It may be primed for a trend reversal or corrective price pullback.
Let's save EG in WL and watch out price uptrend towards the next price resistance.
R 0.570
S 0.515


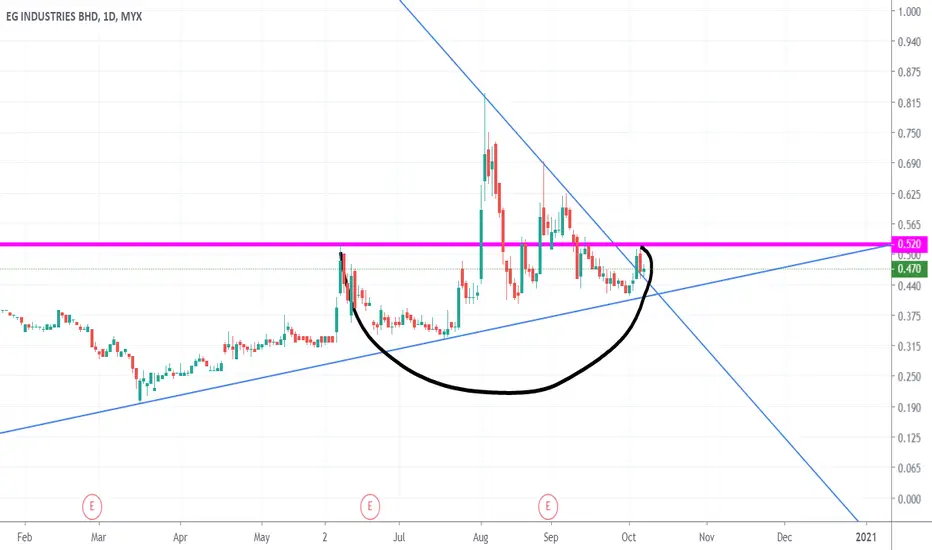
EG - This time for sure?Trendband cycle begin. Today close as Doji candle, so look at High and Low price. This cycle begin near at new LOW and below purple line. Just be careful. The best EP within purple box. Trading plan as shown at right-top.


Trading Idea EG (16/5/2021) Trading Idea EG (16/5/2021)
- Potential breakout above EMA50 (green line)
- Buying opportunity in yellow zone, around RM0.75-0.77
- Target: RM0.865 / RM0.96
- Stoploss below RM0.71
Disclaimer: This trading idea is strictly intended for informational purposes only so please do your own analysis before making any investment decision.

EG - Pre Consolidation BreakoutNO INVESTMENT ADVICE IS PROVIDED
DISCLAIMER
Please consider your own interpretation of Opportunity & Risk. The author of this post strictly follows the Malaysian Security Commission ( SC ) Guidelines on the prohibition of Investment Advice by unlicensed parties. Any examples shall use historical charts without any recommendations and not to cause inducement to the public to take action or position (e.g. buy, sell or hold) regarding a particular class, sector, or instrument in relation to securities or derivatives. The author will never provide any investment or trading advice as the activity of giving investment advice is likely to be considered as a regulated activity under the Capital Markets and Services Act 2007 ( CMSA ). All posts made in Tradingview do not include any communications involving providing recommendations or opinions or includes any material, content or any statement which are likely to induce a person to take any action or position (e.g. buy, sell or hold) regarding a particular class, sector, or instrument in relation to securities or derivatives that is likely to be considered as “advising others concerning securities or derivatives”. The author will not recklessly make any statement, promise or forecast that is misleading, false or deceptive to induce or attempt to induce another person to deal in securities or derivatives. None of information posted in post can be used as investment decisions. Do not trade solely on the information posted. Trade at your own risk and judgement. A trader could potentially lose all money. Only risk capital that can be lost without jeopardizing ones financial security of lifestyle. Please seek licensed professional guidance if you plan to invest your capital seriously.

EG Start Building Position at Support? BOD Beware QR this monthMYX:EG
FiFT BOD Star
VPOC Key Area
Risk less than 8%
MCDX Banker 18%

my analysis regarding EGThis is just a sharing regarding my knowledge.
Dont forget your Trading Plan. Always follow and hold tight. this just for guide to hold.
TAYOR BAYOR


EG VCP BREAKOUTEG breakout the 4 months VCP. After the breakout, market sentiment is bad due to rumors of full lockdown and etc.
For the entire VCP, there are 5 contraction with contraction below:
C1: ~46%
C2: ~33%
C3: ~18%
C4: ~16%
C5: ~7%
Very good entry point on 12 Jan 2021 when it break the C5 contraction. Now the price still not too far from the breakout point. For me still a low risk entry point with ~5-6% risk. Great volume and price interaction as well. Next heavy resistance will be ~0.985 region.
p/s: Also an obvious cup and handle!
Disclaimer:
The content provided is my personal experience sharing through technical and fundamental analysis point of view. The content can only be used for education purposes and NOT any recommendation for buying or selling stock. Please ask your remiser/dealer for making decision. Trade at Your Own Risk.


Telur EGG-kena break 605 utk ke atas..kalau reject..akan bermain semula di 570
- catalyst tntg 5g dh cantik.
-eg tema mask dah hbis..mgkn org trlupa dia buat 5g
- volume pun dh near average line.
-indi2 pun cun.
#sekadarkajian#mgknbetulmgknsalah#adududuud

EG (27/11/2020) breakout symmetrical triangleOn H4 chart, EG has breakout triangle pattern and next TP is around 0.6. The price is currently testing Resistance 0.535 with Support 0.485. A better entry would be at 0.545 after price breakout the resistance zone with TP 0.6, and 0.625 (RRR 1:1.3)
EP 0.545
TP 0.6 / 0.625
SL 0.485 (RRR 1:1.3)
MACD is crossing on H4 chart, signaling a breakout with RSI @ 65 to indicate momentum.
EG is quite a small stock with small balance float (46% of 338M shares) compared to its competitor SCOPE (34% of 769M shares). This adds more speed factor to price action of this stock.
TAYOR


wait the BoD and turtle buy Still uptrend , bull in control
wait the fast turtle buy , Fift BOD
set up at Fib point 0.455 , stand by
Support 0.44 ( 3%)
resistant 0.49 , 0.51 ( 7% )
analysis
Question you need to ask yourself :-
1) Is it UPTREND ? yes ema 20>ema50
2) Is it BULLISH ? yes price >50
3) Is it STRONG BULL ? Fift green all the way
If yes,
4) Where is your Support and Stop Loss ? Support 0.44 ( 3%)
5) Where is your Entry Point ? 0.45 (wait)
6) What is the % risk (Stop Loss - Entry Point)/Entry Point = 3%
7) Can you take this N% risk ?
8) you got a setup , yes wait Fast turtle buy

can the price up up upsideways
double top 0.49
support 0.40
resistant 0.49 / 0.51
Solution
BOB 0.49/ 0.51 ( 40%)
fast turtle& BOD buy ( 30% )
close to support 0.40 ( 30%)
SL below 0.40 /0.39