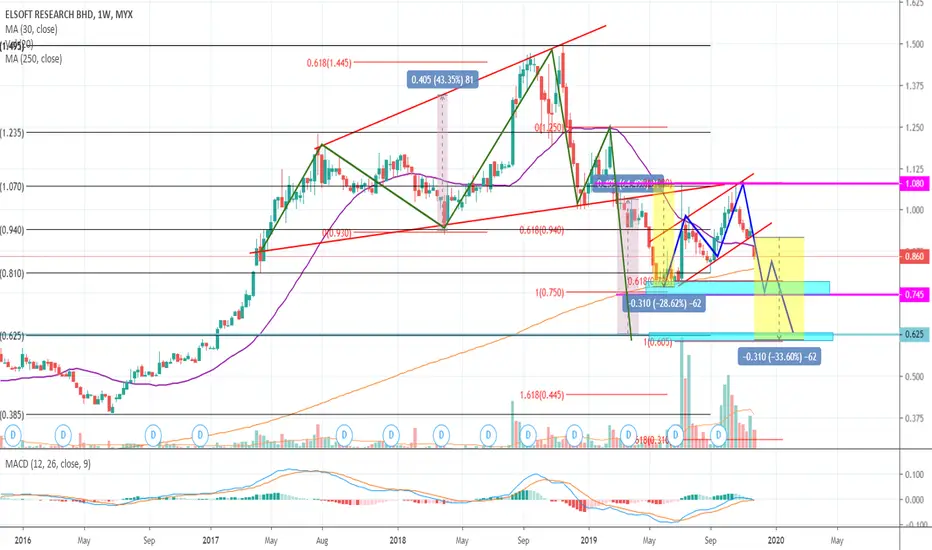
Hit the gradient, bound to the flatWe are viewing a Flat Top, which is a trend that higher possibility breaking Resistance of 0.995.
Low volume can be seen when Daily Candles touch gradient, it will rebound, a good sign still.
As long as Daily Candles buoyant in the Triangle area, it will form higher low, and attempting break 0.995.
ELSOFT trade ideas


ELSOFT RESEARCH BHD (9-FEB-2021)The reversal of the trend has been evidenced by the breaking of the major down trendline since Sept 18.
The consolidation within the “pennant” pattern is unfolding and is hovering around the same price zone after rebounding off 38.2% Fibonacci retracement which coincides with mid-line of BB (20-day SMA)
The stock as a solid chance to break out the pennant pattern.
Next R/ TP:
• 1.04 (50% FE)
• 1.09 (61.8% FE)
• 1.39 (Pole of pennant pattern)
Support:
• 0.855
• 0.795
Note: This trading idea is for educational purpose only and not to be construed as a buy call. The mantra of TAYOR and caveat emptor shall apply.

Is Elsoft ready to continue bullish again?It seems that after sleeping for a while Elsoft is ready to be bullish again

Soft and Safe ClimbCorporate Name : ELSOFT RESEARCH BERHAD
Symbol & Code : ELSOFT (0090)
Board : MAIN
Shariah : Compliant
Sector : Technology
Sub-Sector : Technology Equipment
• Weekly: ELSOF is trying to break the 200ma resistance. Now it’s making a downturn.
• Daily: Price on a steady ascend above 20ma. If it is able to momentum the momentum, the bullish pattern will resume. Early entry and it will be a soft and safe climb.
• EP: 0.86-0.95


ElsoftCubaan pertama menganggarkan TP menggunakan Law Cost and Effect vs Elliot Wave + Fibonacci
Sekadar catatan peribadi menguji ilmu

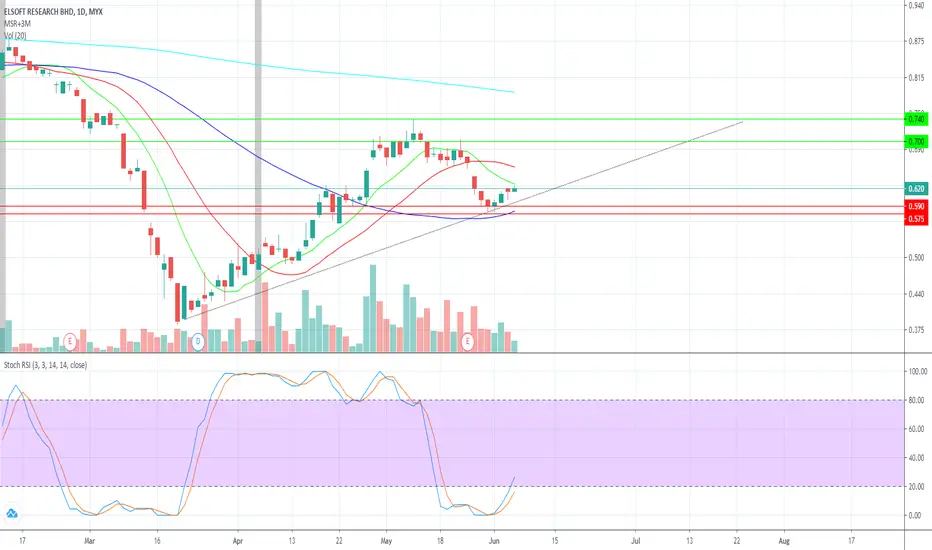
Elsoft possible breakout higher, TP 0.75Elsoft possible to breakout higher. PRICE NOW 0.64
Today volume and price increase. Selling momentum decreases forming a divergence in momentum.
Red line indicates the downtrend line, price are ready to cross up the red line soon.
RISK REWARD RATIO - 1:2.3
TP 0.75
2nd TP 0.9
CL 0.59
Like my works? Please hit the Like, Follow and Share :)
Thanks!

Elsoft - Net Cash company which impacted by Covid-19 PandemicAfter price break RM0.635 and immediate resistance is RM0.67 &RM0.725.
RM0.62 will be crucial support price for re-test/break the previous resistance.
Elsoft's earning may start recover by yr 2021
(Disclaimer: for demonstrate own planned trade records study only and education purpose, not for recommend to buy or sell. Trade at your own risk)


ELSOFT 4/8/20ELSOFT cantik BO pattern dan breakaway gap disokong oleh vol bersama marubozu padu.Tekanan jualan panik menyebabkan ia tidak mampu close dengan solid.
CHART INI HANYALAH UTK KAJIAN DAN BUKAN BUYCALL SILA JAGA TRADING PLAN TUAN/PUAN.


ELSOFT - Bullish Breakout ConfirmedELSOFT
Rst: 0.685
Spp: 0.635
Bullish engulfing formation, confirming breakout from descending wedge, surging RSI and bullish MACD crossover will induce further strength for the stock. Immediate resistance is right at Fibo Extension 23.6% or upper BB.

ELSOFT ANALYSISBest Entry for ELSOFT as the trends looks like an early uptrend and the strong support marked at 590.
Bismillah and entry
#mahersaham
12. ELSOFT - ELSOFT RESEARCH BERHAD ( TEKNOLOGI)2 JUN 2020
EPS (cent): 1.94 *
P/E Ratio: 30.93
ROE (%): 12.93
Profit Margin (%): 52.9
CAGR - Revenue (%): -5.8
Number of Share: 669.46m
EP 0.600
S 0.575
R 0.715

Elsoft - LongA bullish flag pattern appeared, as we can see on the chart.
First TP : 0.74 (previous resistant point)
If price break 0.74 with high volume,
Second TP : 0.8.
First support : 0.66
second support : 0.62
Can cut loss at either 1st or 2nd support level.
No buy or sell call was given. Buy at own risk :)

EASY123 Prediction @MYX ELSOFTLife is simple...Trade with Simplicity!
BUY Signal = (BT-Yellow-Diamond), (White-Candle), (Green-Upward-Triangle), (White-Star)
SELL Signal = (Red-Dot), Red-Downward-Triangle)
*The trend direction: Reversal (Green background Uptrend signal observed)
*The Bottom signal ( BT ) was sighted on 24-Dec.
*Price tested the lifeline (Redline) & close above it on 15-Jan.
*The Bell Alert was triggered on 15-Jan, an indication of a coming signal.
Prediction: The current price just break out the BOX. This will result in the pullback/correction to/nearby the lifeline (Red-line) area. After correction likely will be a new rally.
Preference Strategy: Swing trading (Follow the BUY/SELL Signal respectively.)
Target Price: RM0.91-93 & RM0.98-1.01, RM1.08-1.11
Cut Loss: If broke below S1 Support RM0.79
*Reminder TP & CL is an individual preference & decision. No fix rule or guideline for it...Trade at your own risk.

{SWC}——ELSOFT, Momentum Recharged?Thank you for your continued support :)
Strategy: Price-Volume Analysis
Re-look. Covered and traded earlier. Congrats students from private group who followed and profited earlier.
Bias: Bullish. After a gap up breakout of the consolidation zone 4 days ago, ELSOFT experienced pull back with diminished volume. After T3 pull back, share price is likely to find it support at 0.855.
Momentum is seemed to have recharged.
The strong resistance will be at the gap resistance that meant to be closed.
S: 0.855
R: 0.890, 0.915, 0.935
If you find this idea helpful, kindly leave us a like or comment! :)

{SWC}——ELSOFT, W-shaped bottom formationThank you for your continued support :)
Strategy: Bullish Chart Pattern Formation
Bias: Bullish. ELSOFT, W-shaped bottom well formed with volume today, neckline at RM0.855. W-shaped bottom is a potential trend reversal pattern, which will revere the current unfavorable trend. Furthermore, ELSOFT share price breakout from a short term downtrend line with volume as shown in the chart above.
SWC believes when ELSOFT share price breakout from neckline (RM0.855), it will attract the buying interest and towards our targeted resistance (RM0.89).
SWC expects a positive movement in near term.
If the momentum can bring ELSOFT to close the gap, the next resistance can target at RM0.93.
Support: 0.825
Resistance: 0.89, 0.93