Strong resistance from Daily Time frame If the price can make a new higher high...Strong resistance from the Daily Time frame is at 4533 and 4599...can find the setup for a long position or just wait to see what the market is doing...If the market does not make a new high I will stick to my old plan to remain bearish...
FCPO1! trade ideas
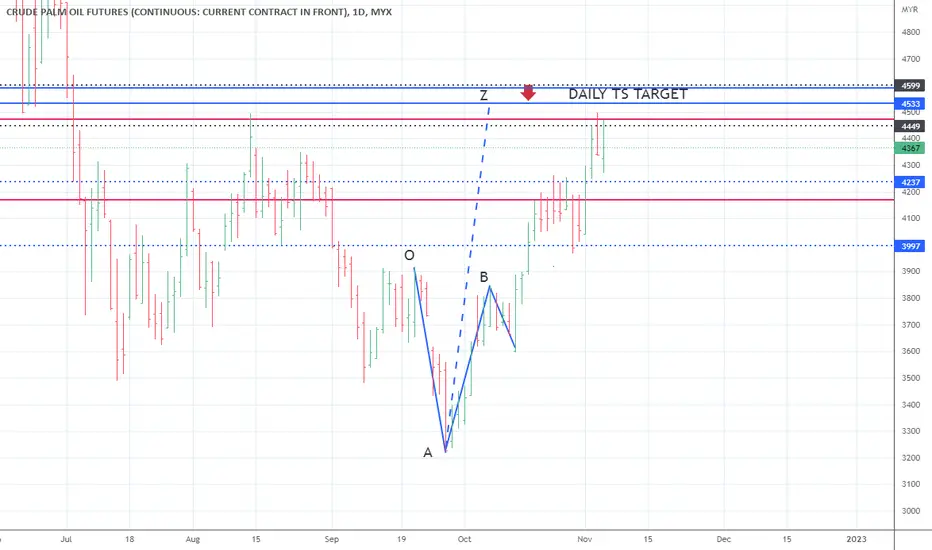
Plan to short fcpoMaybe the price will go lower back today...area the price of 4449 is strong resistance to short back...1st target is 4238 if the price break the low of 4270..if the price break the high of 4497 this analysis is invalid

FCPOEP 4481
TP 4655
SL 4238
Backtest result from 2022-09-27 14:30:00
60 trades
59% win rate
p.s: not a financial advice
#deepagiscreener #tayor #fcpo #bukanbuycall

FCPOEP 4363
TP 4500
SL 4280
Backtest result from 2022-09-21 14:35:00
60 trades
57% win rate
p.s: not a financial advice
#deepagiscreener #tayor #fcpo #bukanbuycall

FCPO 3rd Nov 2022Global data/news (Reuters and Trading Economics)
• Soybeans futures were trading above 14 per bushel in early November, close to six-week highs, supported by supply disruption in top exporter Brazil and growing export sales to major consumer China.
• The dollar index DXY eased below 111.5 on Wednesday, struggling to gain traction as investors stayed on the sidelines ahead of a highly-anticipated Federal Reserve policy decision.
Remarks
• FCPO nearing previous August high 4495
• FCPO trading above daily 100EMA and within weekly resistance zone.
• FCPO reversal head and shoulder in 15 minutes.
•
Short Term Trend : Bullish with major resistance
Trading Plan:
• Short –
o If price fail to break above august high, TP1:4425 TP2:4366 SL:4500.
o If price gap down and break below 4425, TP1:4366 TP2:4325 SL:4450
• Long –
o If price supported above 4366 TP1:4425 TP2:4500 SL:4350
o If price maintain above 4450 TP1:4480 TP2:4530 SL:4423
o
Disclaimer: This is just my IDEA on the market, not a suggestion to open any trade. Please do not follow without any personal due diligence on the market.

2 Nov 2022 FCPO Global data/news
• Gold prices pared some gains on Tuesday as the dollar and bond yields rebounded after strong U.S. jobs data raised worries that the Federal Reserve would stick to its aggressive stance on interest rates for some time.
• Soybeans rose on hopes of more U.S. export sales to China, while protests were eyed in Brazil - including road blocks - after the presidential election.
Remarks
• Previous 1H resistance zone will became immediate support zone.
• Potential Bearish Butterfly harmonic pattern in 1H.
• 1H (20SMA crossing above 50SMA).
• 1H divergence with RSI
Short Term Trend : Sideways
Trading Plan:
• Short –
o Price breakdown 1H resistance zone. TP1:4190 TP2:4079 SL:4300
• Long –
o Price supported and maintain above 1H support zone. TP1:4160 TP2: 4340 SL:4140
o Price maintain above 1H resistance zone. TP1:4340 TP2:4450 SL:4250
Disclaimer: This is just my IDEA on the market, not a suggestion to open any trade. Please do not follow without any personal due diligence on the market.

1st November 2022 Trading PlanGlobal data/news (Reuters and Trading Economics)
• Chicago wheat futures jumped 6% and corn rose more than 2% on Monday as Russia's withdrawal from a Black Sea export agreement raised concerns over global supplies. (Reuters)
• India sharply raised the base import prices of crude and refined palm oil and crude soya oil, the government said in a statement on Monday, as prices jumped in the world market.
• Exports of Malaysian palm oil products for October 1-25 dropped from the same period in September.
• A combination of pressure from the expected rate hikes, the relative strength of the dollar and rising yields continue to pressure gold prices.
Remarks
• FCPO consolidating near daily 100EMA. Major line to break.
• FCPO rebound from 1H 100 EMA twice, both return to the 1H consolidation zone.
• Triangle pattern in 1H chart.
Short Term Trend : sideways
Trading Plan:
• Short –
o Price breakdown and maintain below 1H support zone. TP1:4010, TP2:3980 SL:4080
o Price fail to break 1H resistance zone, TP1:4080, TP2: 4010 SL:4180
• Long –
o Price supported and maintain above 1H support zone. TP1:4155 TP2: 4255 SL:4045
o Price breakup and maintain above 1H resistance zone, TP: 4255 SL:4155
Disclaimer: This is just my IDEA on the market, not a suggestion to open any trade. Please do not follow without any personal due diligence on the market.

MACDMACD is start crosses above the moving average line. This show an uptrend will come. So, I take a long position.

ROCNow ROC for FCPOZ2022 is hover near Zero, so its signal for downtrend for this FCPO. So, the price show a downtrend.

ROCThe ROC indicator is plotted against zero, with the indicator moving upwards into positive territory if price changes are to the upside, and moving into negative territory if price changes are to the downside.NA rising ROC above zero typically confirms an uptrend while a falling ROC below zero indicates a downtrend.BNow ROC is hover near Zero, so its signal for downtrend for this FCPO.

FCPOEP 4107
TP 4189
SL 3964
Backtest result from 2022-09-20 21:00:00
60 trades
57% win rate
p.s: not a financial advice
#deepagiscreener #tayor #fcpo #bukanbuycall


FCPO 27/10/22Global Production data/news
• Chicago Board of Trade grain and soybean futures strengthened on Wednesday as weakness in the U.S. dollar raised hopes for improved export demand for American crops.(Reuters)
• WTI crude futures rose above $87 per barrel on Wednesday, extending gain in the previous session as a weaker dollar boosted the appeal of greenback-priced commodities even after government data pointed to a large build in US crude stockpiles.
• DOW Continue to rise in the middle of earning season and the expectation of soft US data this week signaling that aggressive monetary tightening in recent months is already impacting the economy.
Remarks
• FCPO daily chart still consolidating near the 100EMA and weekly resistance zone.
• 1H chart consolidation zone still in effect since last week and triangle pattern created shows uncertainty in price direction.
• Price rebound from 50MA in 1H chart. Indicating buyer still around to support.
Short Term Trend : Sideways
Trading Plan.
• Long –
o Price maintains supported above 1H Resistance zone. If price gap up, safer to wait for small retracement. TP1: 4250 TP2: 4300 SL:4170.
o Price unable to breakdown and rejection on the 1H Support zone. TP1:4155 SL:4050
• Short - breakdown 1H Resistance zone, TP1: 4100, TP2:4060 SL:4190
Disclaimer: This is just my IDEA on the market, not a suggestion to open any trade. Please do not follow without any personal due diligence on the market.

FCPO : Corrective Phase durationIt is good to know the entire bull market lasted 1024 calendar days(geometric sequence) from 10 July 2019- 29 April 2022 because it can provide a time perspective of the corrective phase.
A high probable 5 wave down sequence surfaced postulating a potential zig zag.
Its also interesting to note the 5 wave down took 152 days (14.8%) before rebounding up.
Prices at 38.2% and 50% of its time projection should be worth noting.
To date, a 3 wave structure is likely completed or near completion and would have to see how the market unfold going forward.

FCPO Week Review 22/10/22Primary Trend: Consolidation ( Weekly)
Resistance Zone = 4500-4200
Support Zone = 3700-3300
Short term Trend: slightly Bullish
Remarks:
• Reversal head and shoulder pattern on daily chart, TP will be within weekly resistance zone.
• RSI trading above daily DMZ(60-40)
• Daily Trading above 20 and 50 MA, nearing 100 EMA
• End of week open interest : 204192 with 50175 contracts on January,2023
Weekly Global Production data/news (Sources : TRADINGECONOMICS.COM)
• Oil prices were little changed this week, as hopes of higher Chinese demand and output cuts by OPEC+ offset lingering fears about a potential global recession-driven demand downturn. OPEC and its allies, including Russia, agreed to cut production by 2 million barrels per day in November.A looming European Union ban on Russian crude also exacerbated concerns about tight supplies.
• Chicago soybean have been trading below $14 per bushel for the past three weeks, hovering close to the two-month low of $13.6 hit on October 6th as fast progress in the US harvest signaled a strong supply to replenish inventories.
25/10/2022 Trading Plan,
• Long
o if breakout above the 1H consolidation zone,TP:4260 SL:4160
o sign of any price rejection on the support zone, TP1:4170, TP2:4240. SL: 4060
• Short if breakdown support zone, TP1: 4040, TP2:3980. SL:4095
Disclaimer: This is just my IDEA on the market, not a suggestion to open any trade. Please do not follow without any personal due diligence on the market.


Price break support with daily have strong bearish candleThe price maybe will be rejected to a downtrend to a strong support area of 3844 to 3812...this target is not valid if the price makes a new higher high

FCPO 15m Reach The resistance in uptrend channel & Triple TopMy prediction based on channel and double top that happen at channel's resistance.

FCPO breakout the downtrendlineLooks like a three bullish candle appear for the second trial...
To break the DOWN trendline.
Let's have a cup of coffe, and see their moves.

FCPO-My analysis wave at FCPOMaybe the price will pull back after the price reach resistance because I see the price in wave 5...can find an opportunity to short if the diagonal pattern is formed

Just wait, there is no thing to do instantly with FCPO1!Just wait, there is no thing to do instantly with FCPO1!
It is really just in a trading range
we are looking in next days for an opportunity.

FCPO Ascending TriangleHi, i am making technical analysis on the FCPO (Dec 2022) chart timeframe 15 minutes.
Let see if going up or down...
If the price breakout the uptrend line, the double top will be used for short.
otherwise, ascending triangle for long!.

FCPO just Moving in The ChannelIt was a great chance to make BUY and SHORT everytime near the support and resistance trendline.
The trend is very very true and real friend. haha
