GC1! : Buy opportunityOn GOLD, we have a strong likelihood of seeing a strong uptrend after the rebound off the support line. However, you must wait until all the analytical conditions are met before entering a buy position.
Furthermore, you can strengthen your buy position after the Vwap indicator breaks.
FGLD1! trade ideas

XAUUSD1!: Buy ideaBuy idea on XAUUSD as you can see on the chart because we have the breakout of the vwap and the RL.

GOLDGOLD HAVE NEGATIVE DIVERGENCE AT DAILY AND WEEKLY TIME FRAME
For this reason, GOLD Susceptible to correction
I THINK IF If geopolitical risks decrease, GOLD CAN BE START CORRECTION TREND

Bullish Gold Trajectory and Fundamental Analysis of XAU/USDThe gold market (XAU/USD) has been exhibiting strong bullish momentum, as evidenced by the price patterns and macroeconomic conditions.
Bullish Price Trajectory: Historical Patterns
The attached chart highlights two distinct bullish patterns in gold's price movement:
1. Pattern 1 (July 18, 2024 – October 30, 2024)
Initial Price: $2,394
Closing Price: $2,762
Percentage Increase: Approximately 15.37%
This pattern reflects a steady upward movement within a defined bullish channel.
2. Pattern 2 (January 7, 2025 – March 14, 2025)
Initial Price: $2,706
Anticipated Closing Price (March 14): $3,100
Applying the same percentage increase from Pattern 1 to Pattern 2 predicts a potential price of $3,121.96, suggesting further upside.
Argument for Repetition of Pattern
The market structure in Pattern 2 closely mirrors that of Pattern 1, with consistent higher highs and higher lows.
The current price trajectory remains within the bullish channel, reinforcing the likelihood of continued upward momentum.
Fundamental Drivers Supporting Bullish Gold Prices
Gold's bullish outlook is supported by several macroeconomic and geopolitical factors:
1. Safe-Haven Demand
Economic Uncertainty: Persistent economic instability, including geopolitical tensions (e.g., wars in Gaza and Ukraine) and global trade disputes, has increased demand for safe-haven assets like gold.
Market Sentiment: Consumer confidence has been declining due to inflation fears and policy uncertainty, prompting investors to hedge risks by buying gold.
2. Central Bank Accumulation
Central banks worldwide have been aggressively buying gold to diversify reserves amid geopolitical risks and concerns about fiat currency stability. This trend provides strong support for gold prices.
3. Easing Monetary Policy
Recent data shows U.S. inflation easing to 2.8% year-on-year in February 2025, down from 3% in January. This has fueled expectations of Federal Reserve interest rate cuts.
Lower interest rates reduce the opportunity cost of holding non-yielding assets like gold, making it more attractive to investors.
4. Weakening U.S. Dollar
A weaker U.S. dollar often boosts gold prices as it becomes cheaper for international buyers. Current monetary policies and fiscal challenges in the U.S., including rising debt levels, are likely to put downward pressure on the dollar.
5. Inflation Hedge
With persistent inflationary pressures globally, gold continues to serve as a reliable hedge against inflation. Analysts expect this trend to persist through 2025.
Technical Analysis Supporting Bullish Outlook
1. Support Levels
The chart shows that gold has rebounded strongly from a well-defined support region around $2,600–$2,700.
This region aligns with prior consolidation zones, indicating strong buyer interest.
2. Moving Averages
Gold prices remain above key moving averages (e.g., EMA-65), signaling sustained upward momentum.
3. Oscillator Signals
The Stochastic Oscillator indicates that prices are rebounding from oversold levels, confirming renewed bullish momentum.
The combination of technical indicators and fundamental drivers strongly supports a bullish trajectory for gold prices in the near term:
Historical price patterns suggest that the current bullish channel could push prices beyond $3,100 by mid-March.
Macroeconomic factors such as easing inflation, central bank buying, geopolitical risks, and monetary policy shifts create a favorable environment for further upside.
Given these conditions, investors and traders should remain optimistic about gold's performance in 2025 while closely monitoring key support levels and macroeconomic developments.

Gold Above $3,000 and MoreAccording to the World Gold Council, more than 600 tons of gold — valued at around $60 billion — have been transported into vaults in New York. Why are they doing that?
Since Donald Trump election in November, there is around $60 billion worth of gold that has flowed into a giant stockpile in New York.
The reason why physical gold is flowing into the US is because traders are afraid Trump might put tariffs on gold.
Gold Futures & Options
Ticker: GC
Minimum fluctuation:
0.10 per troy ounce = $10.00
Micro Gold Futures & Options
Ticker: MGC
Minimum fluctuation:
0.10 er troy ounce = $1.00
1Ounce Gold Futures
Ticker: 1OZ
Minimum fluctuation:
0.25 per troy ounce = $0.25
Disclaimer:
• What presented here is not a recommendation, please consult your licensed broker.
• Our mission is to create lateral thinking skills for every investor and trader, knowing when to take a calculated risk with market uncertainty and a bolder risk when opportunity arises.
CME Real-time Market Data help identify trading set-ups in real-time and express my market views. If you have futures in your trading portfolio, you can check out on CME Group data plans available that suit your trading needs www.tradingview.com
Trading the Micro: www.cmegroup.com

Gold Breaks $3,000: Bulls Maintain Strong Control in the MarketGold Trading Update: The $3K Target Achieved
Gold has reached the $3,000 target as expected. Technical analysis indicates there's still room for further upside, potentially towards the overbought line of the larger uptrend channel. Notably, we're not seeing any signs of supply entering the market yet.
The $3,000 level was our focus, and gold has just hit that today. We've been watching this breakout, which tested on low volume. The upward momentum continues with an extension forming, and volume is now picking up, showing improvement in the trend.
What's Next for Gold Trading?
The current technical indicators suggest we can still move higher. Gold has been advancing for five to six consecutive days, demonstrating persistent improvement to the upside. Supply on the way up is comparable to the previous strong area we've discussed.
What makes this move particularly noteworthy is the absence of significant reactions or pullbacks. The market is showing only very small retracements, indicating bullish strength.
This continued strength without substantial corrections suggests the bull run in gold may continue in the near term. Traders should watch for potential targets at the overbought line of the larger uptrend channel as mentioned in our analysis.
This analysis is for informational purposes only and should not be considered investment advice.

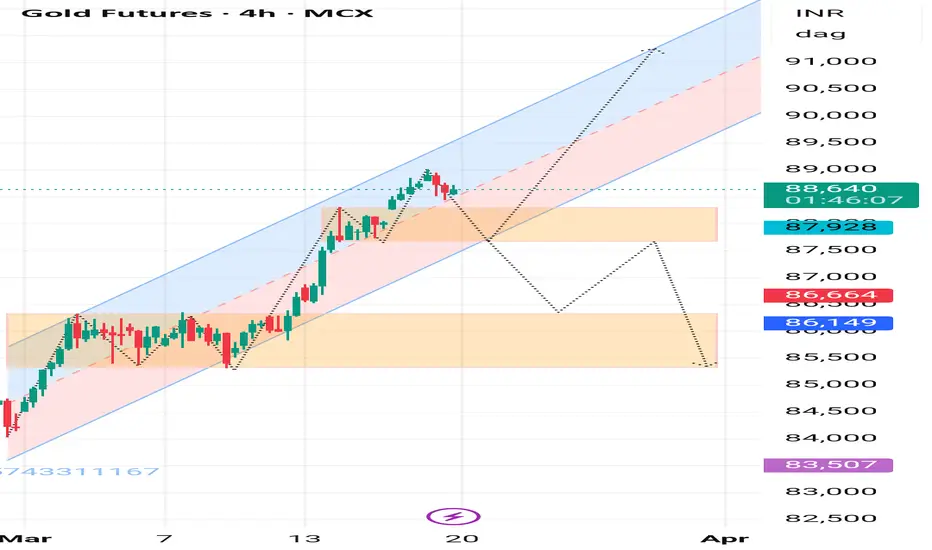
Mcx Gold getting ready for further details (feds decision)### **Gold Futures (MCX) 4H Chart Forecast**
#### **Key Levels:**
- **Resistance:**
- **89,500 - 91,000 INR** (Upper boundary of the trend channel)
- **Support Zones:**
- **87,930 INR** (First minor support)
- **86,665 - 86,149 INR** (Stronger support)
- **85,000 INR** (Major downside target)
#### **Technical Outlook:**
- Gold futures are currently trading around **88,682 INR**, still inside the **ascending channel**.
- **Potential Bullish Scenario:**
- If gold **sustains above 87,930 INR**, it may test **89,500 - 91,000 INR**.
- **Potential Bearish Scenario:**
- If gold **breaks below 87,930 INR**, it could drop to **86,665 - 86,149 INR**.
- Further breakdown below **86,000 INR** could push prices toward **85,000 INR**.
#### **Trading Strategy:**
- **Buy on dips** near **87,930 - 86,665 INR**, targeting **90,000 INR**.
- **Sell below 87,930 INR**, targeting **86,149 - 85,000 INR**.
- Watch for a **breakout above 89,500 INR** for a bullish push toward **91,000 INR**.
GOLD Reached it's Apex and is ready for a dumpIn my earlier posts I said that Gold has the potential to reach the U-MLH, which has become true.
Up there, the price of Gold is stretched. Yes it can go up even more beyond the Upper-Medianline-Parallel. But the overall numbers of occurrences are small.
So, at this natural stretch, price has a high probability to revert to the mean. And this is supported by the fact, that the overall indexes are heavenly oversold and already showing the signs of a pullback to the North (see my last NQ post).
Why not just watch how it plays out, and make a decision for a trade after the FOMC, or even tomorrow. Don't rush into these unknowing situations. Be patient and wait for clear signs to take action.

GOLD is bullish, but is it giving a Entry?Extremely bullish on Gold but looking for the safe entry before getting in for the run. It looks like they want to pull back. Just have to wait it out and see if it lines up inside of the killzone.

Gold The chart follows Elliott Wave Theory, Fibonacci retracements, and trend channel analysis. Here’s a summary of the key observations:
Key Technical Observations:
Elliott Wave Analysis:
The chart follows a five-wave impulse pattern.
Wave 3 appears to be reaching its peak, while wave 4 is anticipated to correct before wave 5 extends further.
Fibonacci Levels:
Key retracement levels are marked for potential corrections (e.g., 0.382 at ~2,945.5 and 0.5 at ~2,369.2).
An important 1.618 Fibonacci extension is at 3,101.3, indicating a potential price target.
Trend Channel:
The price is trading within an ascending parallel channel.
The upper boundary of this channel aligns with a potential wave 5 target near 3,845.2.
Support & Resistance Levels:
Support: ~2,804.2 and 2,561.2
Resistance: 3,044.3 (current high) and potential further levels at 3,101.3 and beyond.
RSI Indicator:
RSI (Relative Strength Index) is currently at 72.90, which suggests overbought conditions.
A possible correction (wave 4) could follow before the next bullish leg.
Summary:
Gold prices are in a strong uptrend but might face a short-term correction (wave 4) before resuming their uptrend (wave 5).
Fibonacci levels and trend channels indicate potential retracement zones (~2,945 or ~2,369) before the next leg higher.
RSI suggests overbought conditions, hinting at a possible pullback.
Long-term target could be around 3,845.2.

We Need a Retrace before the breakout IMO on GoldI want to go long. I am long on gold. but I need to see it pull back and establish a low for he week first before I'm interested in attempting the long. This would make for a much stronger move. Just have to be patient and wait for it all to line up inside of the killzone.

Bullish MoveOnce price reaches 3004.6 and retest that level then it will complete the final part of the (W) formation.

Behind the Curtain: Unveiling Gold’s Economic Catalysts1. Introduction
Gold Futures (GC, MGC and 1OZ), traded on the CME market, are one of the most widely used financial instruments for hedging against inflation, currency fluctuations, and macroeconomic uncertainty. As a safe-haven asset, gold reacts to a wide range of economic indicators, making it crucial for traders to understand the underlying forces driving price movements.
By leveraging machine learning, specifically a Random Forest Regressor, we analyze the top economic indicators influencing Gold Futures on daily, weekly, and monthly timeframes. This data-driven approach reveals the key catalysts shaping GC Futures and provides traders with actionable insights to refine their strategies.
2. Understanding Gold Futures Contracts
Gold Futures (GC) are among the most actively traded futures contracts, offering traders and investors exposure to gold price movements with a range of contract sizes to suit different trading strategies. CME Group provides three types of Gold Futures contracts to accommodate traders of all levels:
o Standard Gold Futures (GC):
Contract Size: Represents 100 troy ounces of gold.
Tick Size: Each tick is 0.10 per ounce, equating to $10 per tick per contract.
Purpose: Ideal for institutional traders and large-scale hedgers.
Margin: Approximately $12,500 per contract.
o Micro Gold Futures (MGC):
Contract Size: Represents 10 troy ounces of gold, 1/10th the size of the standard GC contract.
Tick Size: Each tick is $1 per contract.
Purpose: Allows smaller-scale traders to participate in gold markets with lower capital requirements.
Margin: Approximately $1,250 per contract.
o 1-Ounce Gold Futures (1OZ):
Contract Size: Represents 1 troy ounce of gold.
Tick Size: Each tick is 0.25 per ounce, equating to $0.25 per tick per contract.
Purpose: Provides precision trading for retail participants who want exposure to gold at a smaller contract size.
Margin: Approximately $125 per contract.
Keep in mind that margin requirements vary through time as market volatility changes.
3. Daily Timeframe: Key Economic Indicators
Gold Futures respond quickly to short-term economic fluctuations, and three key indicators play a crucial role in daily price movements:
o Velocity of Money (M2):
Measures how quickly money circulates within the economy.
A higher velocity suggests increased spending and inflationary pressure, often boosting gold prices.
A lower velocity indicates stagnation, which may reduce inflation concerns and weigh on gold.
o Unemployment Rate:
Reflects the strength of the labor market.
Rising unemployment increases economic uncertainty, often driving demand for gold as a safe-haven asset.
Declining unemployment can strengthen risk assets, potentially reducing gold’s appeal.
o Oil Import Price Index:
Represents the cost of imported crude oil, influencing inflation trends.
Higher oil prices contribute to inflationary pressures, supporting gold as a hedge.
Lower oil prices may ease inflation concerns, weakening gold demand.
4. Weekly Timeframe: Key Economic Indicators
While daily fluctuations impact short-term traders, weekly economic data provides a broader perspective on gold price movements. The top weekly indicators include:
o Nonfarm Payrolls (NFP):
Measures the number of new jobs added in the U.S. economy each month.
Strong NFP numbers typically strengthen the U.S. dollar and increase interest rate hike expectations, pressuring gold prices.
Weak NFP figures can drive economic uncertainty, increasing gold’s safe-haven appeal.
o Nonfarm Productivity:
Represents labor efficiency and economic output per hour worked.
Rising productivity suggests economic growth, potentially reducing demand for gold.
Falling productivity can signal economic weakness, increasing gold’s appeal.
o Personal Spending:
Tracks consumer spending habits, influencing economic activity and inflation expectations.
Higher spending can lead to inflation, often pushing gold prices higher.
Lower spending suggests economic slowing, which may either weaken or support gold depending on inflationary outlooks.
5. Monthly Timeframe: Key Economic Indicators
Long-term trends in Gold Futures are shaped by macroeconomic forces that impact investor sentiment, inflation expectations, and interest rates. The most influential monthly indicators include:
o China GDP Growth Rate:
China is one of the largest consumers of gold, both for investment and jewelry.
Strong GDP growth signals robust demand for gold, pushing prices higher.
Slower growth may weaken gold demand, applying downward pressure on prices.
o Corporate Bond Spread (BAA - 10Y):
Measures the risk premium between corporate bonds and U.S. Treasury bonds.
A widening spread signals economic uncertainty, increasing demand for gold as a safe-haven asset.
A narrowing spread suggests confidence in risk assets, potentially reducing gold’s appeal.
o 10-Year Treasury Yield:
Gold has an inverse relationship with bond yields since it does not generate interest.
Rising yields increase the opportunity cost of holding gold, often leading to price declines.
Falling yields make gold more attractive, leading to price appreciation.
6. Risk Management Strategies
Given gold’s volatility and sensitivity to macroeconomic changes, risk management is essential for trading GC Futures. Key risk strategies may include:
Monitoring Global Liquidity Conditions:
Keep an eye on M2 Money Supply and inflation trends to anticipate major shifts in gold pricing.
Interest Rate Sensitivity:
Since gold competes with yield-bearing assets, traders should closely track interest rate movements.
Higher 10-Year Treasury Yields can weaken gold’s value as a non-yielding asset.
Diversification and Hedging:
Traders can hedge gold positions using interest rate-sensitive assets such as bonds or inflation-linked securities.
Gold often performs well in times of equity market distress, making it a commonly used portfolio diversifier.
7. Conclusion
Gold Futures remain one of the most influential instruments in the global financial markets.
By leveraging machine learning insights and macroeconomic data, traders can better position themselves for profitable trading opportunities. Whether trading daily, weekly, or monthly trends, understanding these indicators allows market participants to align their strategies with broader economic conditions.
Stay tuned for the next "Behind the Curtain" installment, where we explore economic forces shaping another key futures market.
When charting futures, the data provided could be delayed. Traders working with the ticker symbols discussed in this idea may prefer to use CME Group real-time data plan on TradingView: www.tradingview.com - This consideration is particularly important for shorter-term traders, whereas it may be less critical for those focused on longer-term trading strategies.
General Disclaimer:
The trade ideas presented herein are solely for illustrative purposes forming a part of a case study intended to demonstrate key principles in risk management within the context of the specific market scenarios discussed. These ideas are not to be interpreted as investment recommendations or financial advice. They do not endorse or promote any specific trading strategies, financial products, or services. The information provided is based on data believed to be reliable; however, its accuracy or completeness cannot be guaranteed. Trading in financial markets involves risks, including the potential loss of principal. Each individual should conduct their own research and consult with professional financial advisors before making any investment decisions. The author or publisher of this content bears no responsibility for any actions taken based on the information provided or for any resultant financial or other losses.

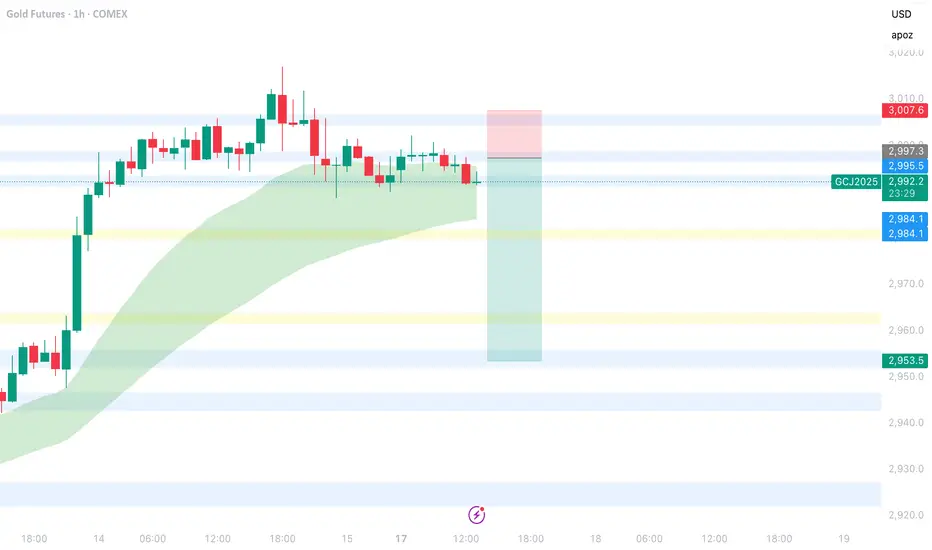
Gold - Good Risk/Reward on move potential move lowerGold has pushed up to the $3k mark over the past few days but lacks volume/momentum to hold $3k and move higher from there.
The recent market dislocation (Gold Futures vs Spot rate) which resulted in physical gold moving from London vaults to NYC has narrowed so that driver for the price has subsided.
Macro Economic turmoil (tariff uncertainty) looks more priced into markets now (although who knows where the bottom is) but gold as safe-haven at current levels looks less enticing for investors.
Gap up from circa $2,955- $2,990 with little market structure between makes sharp drop more likely than further drive higher at this point.
Any move higher likely to be more subdued rather than sharp which allows for tighter stop loss just above $3k mark with $2.98k the next stop then $2.96k then to $2.95k where it meets stronger market structure.
This makes for a 4:1 reward/risk but worth trimming position at weaker (yellow) demand levels/movign stop to break even as/when the move starts playing out.
Wait for move higher toward $2.97k to enter on optimal risk/reward ration and expect any move sharply lower to be in London-NY open hours.
***Remember there is no certainty, only probability combined with good risk management***
Gold Analysis Futures Pricing: Gold, The Revival....A clear pattern emerged as liquidity exited cryptocurrencies, equities, and indexes, redirecting into gold amid significant institutional short positioning ahead of its break above $3,000. This capital rotation indicated a well-orchestrated move, aligning with broader macroeconomic and geopolitical interests.
Given this dynamic, there is reason to believe the Trump administration may favor a stronger gold market, potentially as a strategic measure to ease geopolitical tensions with Russian President Vladimir Putin. Putin has previously expressed dissatisfaction with gold’s position relative to digital assets in global markets, making this shift particularly noteworthy.
I am requesting reputation points to contribute further insights. Engage with this post—like, follow, and comment to continue the discussion.

Sit on hands! Wait for Gold to reveal its move!Letting monday play out. We should get a better, clear move on Tuesday after price has moved to establish a low for the week. not trying to be to early to the party so we wait for now.

GOLD - WEEKLY SUMMARY 10.3-14.3 / FORECAST🏆 GOLD – 3rd week of the new base cycle (15-20+ weeks). The previous cycle lasted 15 weeks. This may have been the shortest correction to a base cycle low in gold’s history. The reason lies in retrograde Venus, which strongly impacts currencies and, in turn, gold. This year, retrograde Venus crashed the dollar, amplifying gold’s bullish momentum.
In my February 23 post, I wrote:
"The next extreme forecast is March 3 – the beginning of the retrograde Venus period, which I mentioned in early December. I cautiously assume that March 3 could mark the start of a new base cycle in gold from one of the listed support levels."
👉 I also did not rule out the start of a new cycle in the last post. By then, our long position from the March 3 extreme forecast had already reached breakeven. This extreme forecast reversed gold upward from the extreme forecast level of October 28 (2850 on current futures).
⚠️ Next extreme forecasts for gold: March 17 and March 24.


Shorting Gold!Gold has been on a TEAR through 2025. Overextended in ATH territory and more expensive than ever before in history. Logically, we should expect a return to historically normal (still expensive) prices.
Daily chart is showing 3/3 sell signals
1. Price below 9 period MA
2. RSI bearish fanning beautifully from overbought levels
3. Average Daily Range expanding with volatility
I'm aggressively watching for shorts on Gold, Silver, and Copper in the weeks ahead. I've outlined 3 possible entries IF we're lucky enough to see some kind of relief from last weeks selloff. Should price proceed to fall, preparing smaller time frame short trades. I strongly believe we will see 2800. Strategy is invalidated if price breaches ATH's

Confirmed Breakout!!! wait for the pullback on Gold!The price action I was looking for yesterday didnt happen till mid London session after i stopped looking. Now that we have confirmed bullish im looking for a pull back inside of a gap before taking any entry.

Use Buy The Dip Like a LynchWhile we can’t say for certain that Merrill Lynch specifically uses VWAP (Volume Weighted Average Price) in their strategies, one thing is clear: they certainly rely on sophisticated statistical tools and data-driven insights to inform their investment decisions. Merrill Lynch, known for its expertise and successful track record, employs a range of techniques to navigate market fluctuations and identify profitable opportunities.
In the fast-paced world of trading, every decision counts. One strategy that has stood the test of time is Buy the Dip (BTD). This approach involves buying assets after they’ve experienced a temporary drop, anticipating that the price will bounce back 📉➡️📈. However, timing the dip correctly can be challenging without accurate data and predictive tools.
This article explores how to enhance your Buy the Dip predictions using OHLC Range Map and 4 VWAPs set to Century on TradingView.
What is the Buy the Dip Strategy? 🤔
The Buy the Dip (BTD) strategy is simple yet effective. Traders buy an asset after its price has fallen, believing that the dip is temporary and the price will soon rise again 📉➡️📈. The challenge, however, is knowing when the dip is truly an opportunity rather than the start of a longer-term downtrend.
This is where data-driven insights come into play. Rather than relying solely on intuition, having the right tools can make all the difference. With the OHLC Range Map, traders can gain a clearer understanding of price action, which helps identify whether a dip is worth buying 💰.
Strategies for Predicting Buy the Dip Levels 📍
Spot the Dip Using 4 VWAPS set to Century
Spot the Dip Using OHLC Range Map
1. Spot the Dip Using 4 VWAPS set to Century 🎯
Load 4 VWAPs on the chart, and configure them as follow:
1st VWAP: Source - Open, Period - Century
2st VWAP: Source - High, Period - Century
3rd VWAP: Source - Low, Period - Century
4th VWAP: Source - Close, Period - Century
When the price approaches key support or resistance zones, such as VWAP bands, particularly for well-established assets like ES, NQ, BTC, NVDA, AAPL, and others, there's a high probability of price reversal.
By combining this with price action analysis, you can identify precise entry points for a position with greater accuracy.
2. Spot the Dip Using OHLC Range Map 👀
The OHLC Range Map is a powerful statistical tool designed to plot key Manipulation (M) and Distribution levels over a specific time period. By visualizing these levels, traders can gain insights into market behavior and potential price movements.
For example, when analyzing the ES chart, we can observe that the bearish distribution level has already been reached for the next 12 months. This suggests that the market may be poised for a reversal, with the expectation of higher prices in the near future. By identifying these critical levels, traders can anticipate market trends and adjust their strategies accordingly.
Key Takeaways 🔍📊
Buy the Dip (BTD): The BTD strategy involves buying assets after a temporary price drop, expecting a price rebound.
Enhancing BTD Predictions: Using OHLC Range Map and 4 VWAPs on TradingView improves the accuracy of Buy the Dip predictions.
Spotting the Dip with 4 VWAPs: Configuring 4 VWAPs (Open, High, Low, Close) on a chart helps identify key support and resistance zones for potential price reversals.
Using the OHLC Range Map: The OHLC Range Map helps pinpoint Manipulation and Distribution levels, aiding in market trend anticipation and timing.
Combining Tools for Precision: Integrating the OHLC Range Map and VWAPs with price action analysis allows for more accurate Buy the Dip entry points.

GOLD FUTURES: SUPER SIDEWAYS ACTION. TRADERS DEATH VALLEYGold appears to be forming a bullish flag pattern, consolidating before a potential breakout toward $3,000. Institutional shorting activity has been detected ahead of this key level, which could indicate strategic positioning or an attempt to suppress price momentum. This movement also aligns with broader macroeconomic sentiment, suggesting that Trump’s policies may be perceived as favorable for the U.S. dollar, potentially influencing gold’s price action.
The market remains in a sideways phase, awaiting further confirmation of direction.

We shall Continue with Bullish activity on GOLD?Looking for a bullish play as I seen the Dollar broke its weekly level. Looking for it to continue but need to see a pullback for entry first. We must wait for the killzones for sure.
