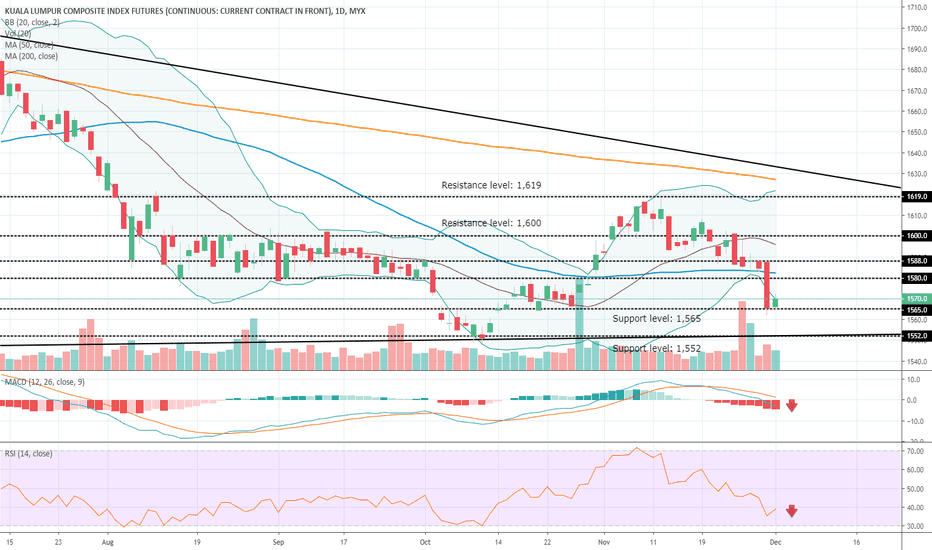
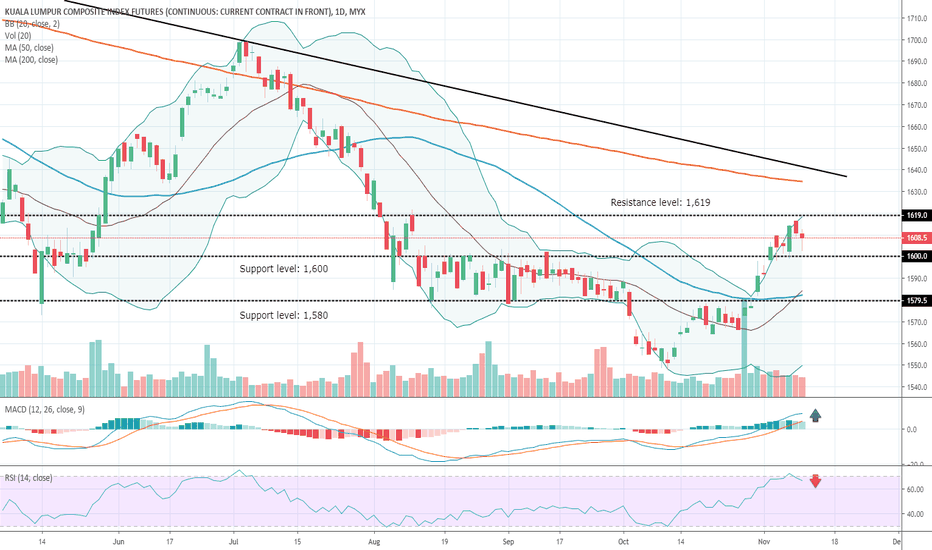
FKLI REVERSALThe bottom have been in. We printed a higher low on daily time frame. Crucial 1600. If we break up we try to reach the yellow trend line. Longby ToraHendricks4
KLSE. FKLI. The last time KLSE blew pass this box. It went down. With the current market sentiment and constant bearish news. 2 scenarios. We might continue to dump today. Or We will get a dead cat bounce then dump further to the next support. Shortby crytoG1nUpdated 1
FKLI encounter mid-point resistance level.Today FKLI's buyers start slowing down at mid-point resistance level (1651 level) . If buyers failed to breakthrough 1651 resistance level, we could see price retrace to 1635 level. DISCLAIMER: ABOVE ARE BASED ON MY OWN ANALYSIS, IT'S NOT A BUY/SELL CALL AND DOES NOT CONSIDER YOUR RISK APPETITE.by Boring_Trader5
FKLI analisaFKLI agak bearish .ia tidak dpt berdiri di atas ma 20. macd walaupun golden cross tapi masih di bawah bear zone. resistance pada minggu lepas berada pada 1659by LlaaKaSon1
FKLI Ride the UPTrendeven the market open today is gapping down but the candlestick is still close in bull candle. try to ride the trend when there is the retracement. can wait at the price 1710. need to wait for the price action for confirmation. Longby Vinn_Wee_271
FKLI - Rebound From 3.5 Years Confluence ZoneIf you look at daily chart, FKLI did not move any lower than 1606 since 2015. Market trade in 150 range for 1 year before a rally started in Jan 2017 and brought market to 1900. The recent low 1655 become a new price level to monitor and further expand the zone by 50 points from 1606 to 1656 (as confluence zone highlighted in the chart). The market have tested the "confluence zone" 6 months ago and rebound. 2 days ago, price further tested 1647 and then rebound to today's high 1674. Here the current swing projection to manage your trades: If price trade above 1674, price target 1678. If price trade above 1678, price target 1698.5. If price trade above 1698.5, price target 1730 (Major resistance as highlighted in red arrow) Trader please be aware potential pull back from each target level.Longby JohnkiewUpdated 2
FKLI heading to bear cave? From trendline analysis, FKLI level still trading within downtrend line. No visible breakout is observed at the moment to break the bear spell. Trading Plan: Short: 1668 (2 points lower than 1670 physological level) Target: 1655 ; 1640 Cut loss: 1680 Shortby ilovewmlUpdated 1
Continuation of Mark-Down Stage in FKLI ChartFKLI chart continue to show weakness with the continuation of mark-down stage after re-distribution. Notice a huge Sell-Off bar follow by Up-Thrust pushes the price back to the trend line. Based on 30-minute FKLI chart, we’ll continue to short with the next Sign of Weakness (Up-Thrust) at resistance level. Send us your preference stock to review based on TradeVSA chart by comment at below. Disclaimer This information only serves as reference information and does not constitute a buy or sell call. Conduct your own research and assessment before deciding to buy or sell any stock Shortby MartinTFWong1
FKLI Failed to Break Above ResistanceBased on 30 minute chart above, FKLI failed to break the resistance even with lots of Sign of Strength. The failed breakout mean lack of interest by Smart Money in long position. The bars subsequent close lower with Sign of Weakness (Sell-Off) show there is a chance Mark-down stage will continue. Send us your preference stock to review based on TradeVSA chart by comment at below. Disclaimer This information only serves as reference information and does not constitute a buy or sell call. Conduct your own research and assessment before deciding to buy or sell any stock Shortby MartinTFWong1
FKLI Potential double bottom As long as FKLI price stay above 1673. FKLI have higher chance of going up with 1st uptrend target 1730, second uptrend target 1760 (EMA 200). However, if price break below 1673 mean FKLI fail to forming double bottom and will resume downtrendLongby Boring_Trader4
FKLI - Missed the bottom Missed the support entry. Hopefully entry at noon will be a good one >> Find us on Twitter & Telegram! We'll be happy to help DISCLAIMER This presentation solely meant for information purpose and does not constitute as investment advice. We may or We may not take the trade that we presented. All estimates, projections, forecasts, expressions of opinion and other subjective judgments contained in the presentation are based on assumptions that considered to be reasonable. We are not responsible for any liabilities arising from the result of your market involvement or individual trade activities. Longby nicnyx12
FKLI...at important crossroadsAt the risk sounding like a broken record... trading is a game of planning and probability. A break and close above the green trendline is a welcome message for the bulls. We could see market potentially reaching 1,750 or even 1,800 structure. A break and close below the red trendline is a good news for bears. We could potentially see the market retest 2018's lows or worst. As traders...just plan your trade and trade your plan.by davidleekuanyong1
Bullish Bat's PRZ Complete. KLCI FUTURES(FKLI)PRZ For Bullish Bat's complete. 38.2-61.8 target...????Longby rijalfcpo2
FKLI, COMPLETION OF WAVE FKLI completed 5 waves of downtrend, assuming a bounce for the correction stage if it stay above yesterday's low 1665.5Longby nicole0804Updated 4
FKLI - Next target 1668Selling will likely find support near previous low 1668. Two fibonacci spirals overlapping the same level.Shortby JohnkiewUpdated 117
FKLI.. After Showering head & Shoulder..How?FKLI.. After Showering head & Shoulder..How?Shortby SteveTan3