FKLI analisaFKLI agak bearish .ia tidak dpt berdiri di atas ma 20. macd walaupun golden cross tapi masih di bawah bear zone. resistance pada minggu lepas berada pada 1659
FKLI1! trade ideas


FKLI Ride the UPTrendeven the market open today is gapping down but the candlestick is still close in bull candle.
try to ride the trend when there is the retracement.
can wait at the price 1710. need to wait for the price action for confirmation.

FKLI - Rebound From 3.5 Years Confluence ZoneIf you look at daily chart, FKLI did not move any lower than 1606 since 2015. Market trade in 150 range for 1 year before a rally started in Jan 2017 and brought market to 1900. The recent low 1655 become a new price level to monitor and further expand the zone by 50 points from 1606 to 1656 (as confluence zone highlighted in the chart).
The market have tested the "confluence zone" 6 months ago and rebound. 2 days ago, price further tested 1647 and then rebound to today's high 1674.
Here the current swing projection to manage your trades:
If price trade above 1674, price target 1678.
If price trade above 1678, price target 1698.5.
If price trade above 1698.5, price target 1730 (Major resistance as highlighted in red arrow)
Trader please be aware potential pull back from each target level.

FKLI heading to bear cave? From trendline analysis, FKLI level still trading within downtrend line. No visible breakout is observed at the moment to break the bear spell.
Trading Plan:
Short: 1668 (2 points lower than 1670 physological level)
Target: 1655 ; 1640
Cut loss: 1680

Continuation of Mark-Down Stage in FKLI ChartFKLI chart continue to show weakness with the continuation of mark-down stage after re-distribution. Notice a huge Sell-Off bar follow by Up-Thrust pushes the price back to the trend line.
Based on 30-minute FKLI chart, we’ll continue to short with the next Sign of Weakness (Up-Thrust) at resistance level.
Send us your preference stock to review based on TradeVSA chart by comment at below.
Disclaimer
This information only serves as reference information and does not constitute a buy or sell call. Conduct your own research and assessment before deciding to buy or sell any stock


FKLI Failed to Break Above ResistanceBased on 30 minute chart above, FKLI failed to break the resistance even with lots of Sign of Strength. The failed breakout mean lack of interest by Smart Money in long position. The bars subsequent close lower with Sign of Weakness (Sell-Off) show there is a chance Mark-down stage will continue.
Send us your preference stock to review based on TradeVSA chart by comment at below.
Disclaimer
This information only serves as reference information and does not constitute a buy or sell call. Conduct your own research and assessment before deciding to buy or sell any stock

FKLI Potential double bottom As long as FKLI price stay above 1673. FKLI have higher chance of going up with 1st uptrend target 1730, second uptrend target 1760 (EMA 200).
However, if price break below 1673 mean FKLI fail to forming double bottom and will resume downtrend

FKLI - Missed the bottom Missed the support entry. Hopefully entry at noon will be a good one
>> Find us on Twitter & Telegram! We'll be happy to help
DISCLAIMER
This presentation solely meant for information purpose and does not constitute as investment advice. We may or We may not take the trade that we presented. All estimates, projections, forecasts, expressions of opinion and other subjective judgments contained in the presentation are based on assumptions that considered to be reasonable. We are not responsible for any liabilities arising from the result of your market involvement or individual trade activities.

FKLI...at important crossroadsAt the risk sounding like a broken record... trading is a game of planning and probability. A break and close above the green trendline is a welcome message for the bulls. We could see market potentially reaching 1,750 or even 1,800 structure. A break and close below the red trendline is a good news for bears. We could potentially see the market retest 2018's lows or worst.
As traders...just plan your trade and trade your plan.

Bullish Bat's PRZ Complete. KLCI FUTURES(FKLI)PRZ For Bullish Bat's complete. 38.2-61.8 target...????

FKLI, COMPLETION OF WAVE FKLI completed 5 waves of downtrend, assuming a bounce for the correction stage if it stay above yesterday's low 1665.5

FKLI - Next target 1668Selling will likely find support near previous low 1668. Two fibonacci spirals overlapping the same level.


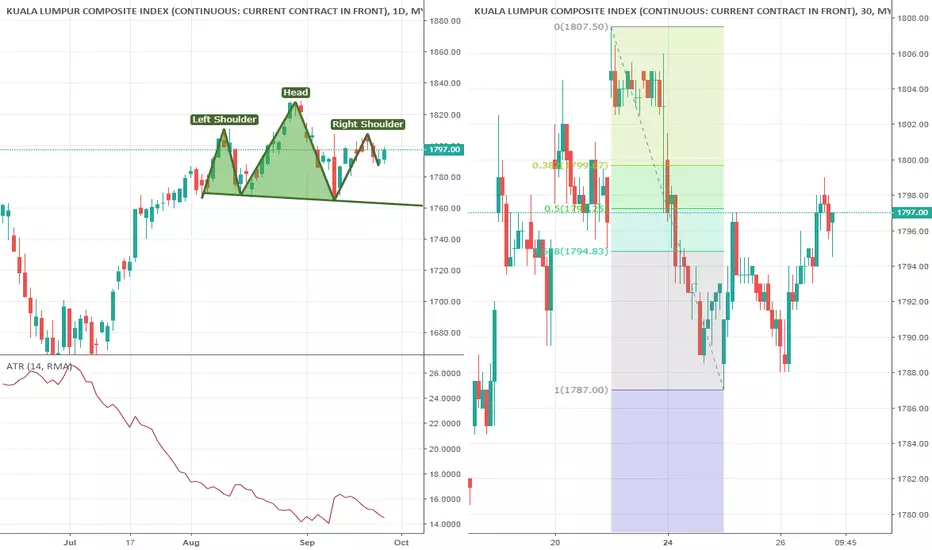
FKLI - Congesting Range On the left daily chart, FKLI is forming a head and shoulder like formation which seen recent high 1807.5 almost symmetrically to Aug high. The formation was not confirmed and will be invalid if price make higher high and price did not fall below 1764.5. Daily ATR (Average True Range) seen FKLI daily range at 6 months low. Intra day trader may found difficulties on intraday trading if the range continue to congest.
As the daily chart suggest, the correction in intraday is expect to be tightening range if without breakout. The current ATR in 30 minutes time frame at only 2.5 points. Current price resistance at 1800, price above 1800 may see expanding range. Sideway range between 1799 to 1787.
FKLI - Short Term CorrectionFKLI set for mixed start of the day, with Dow pull back from historical high as Fed decision ahead.
Yesterday intraday high 1797 was 50% retracement of previous swing from 1807.5. This suggest the price in short term selling structure. As price below 1797, FKLI may retest yesterday low 1787. Major support at 1786 & 1781 (see left chart). Overall trend remain bullish while short term correction.
As FKLI Sep moving ahead expiry, trader may start trading Oct contract if intention to hold beyond this week.
Malaysia data for the week ahead:
12:00 PM PPI YoY AUG
03:00 PM M3 Money Supply YoY AUG

FKLI - Bullish Sentiment RemainMarket quickly pull back from yesterday projection 1798.5 zone and fill the opening gap. The intraday price structure found support at 50% retracement level (left chart) and close at mid of intraday range.
With Dow trading at 8 months high, FKLI expect to retest 1800 zone. Trader please aware that the current FKLI vs Dow correlation at only 20% positive related. Emerging market sentiment still under-perform US market.
A few scenarios illustrate for intraday trading as follow:
1. Price trade higher than 1798.5, breakup may rally to 1805 and 1809.
2. Price hover below 1798.5, FKLI trading in range support at 1789 and resistance at 1797.
3. Price move lower than 1789 will change the current structure to sell.


FKLI - Rebound to 1798.5Market arguably the latest development likely to be less intense than actual feared. Market have adapt US-China tariff war with quick rebound on yesterday.
FKLI found support at 50% retracement level 1781 (left chart) and coincidentally projection of down swing at 1782 (right chart). FKLI quickly rebound following regional sentiment like Dow & Hang Seng during Intraday.
The current rebound is likely to continue, up swing projection on the right chart, if price above 1791.5, next impulsive size at 1798.5. This price level was near to previous high. With Nikkei up, FKLI likely to open high and rebound higher.
