FKLI TRADING : 310) downtrend persiststhis is number 310...
Today is 2nd Dec 2021, and fkli-dec is in downtrend. After consolidation phase, now fkli-dec is in full downtrend. It dropped below the 1512 supports and and stopped at 1497 yesterday. Today, a gap down and possible rebound frm 1481.5 support. It has to break abv 1525 previous lower-high before confirming a reversal. The next level is at 1457, 1412.
As for the bearish bat pattern in previous episode, it missed the entry 1535 by a mere 2pts. Then the price rollover and fell hitting the 1st tp at 1512.5 and the 2nd tp at 1500. The next thing to watch is resistance level at 1497-1500, 2nd resistance level at 1512.5 - 1525...These are the levels to watch during rebound to short. Juz the thingy I will do, not buy call. Trade at your own risk.
higher resistance : 1512.50-1525
immediate resistance : 1497-1500
immediate support : 1481.5 (critical support)
WARNING!
RISK DISCLAIMER : this is juz a trading idea...trading stocks, futures , crypto, commodities or forex might incur a huge risk to your account/funds… DON’T LOSE MONEY THAT YOU CANNOT AFFORD …any idea(s) of trading in this episode SHALL NOT be regarded as a hint of BUYING or SELLING . It is MERELY a trading journal and it has been used for educational purpose only… trade at your own risk!
**your "LIKE" and "FOLLOW" are my main source of motivation to continue posting more valuable contents...TQ*
FKLI1! trade ideas

FKLI is waiting to trigger update 30 NOV 2021Follow 3 steps for entry
1. 1st breakout done
2. Retracement
3. 2nd breakout and heading back to the earth
ready to back now?
let's go, traders!

FKLI done 2nd breakout and heading to the skyFollow 3 steps to entry
1. 1st breakout
2. retracement 61.8%
3. 2nd breakout
let's wait for PROFIT !
it's all about elliott waves analysis
Cheers~~

FKLI TRADING : 308) same fate, different patternthis is number 309...
Today is 19th Nov 2021, and fkli-nov is still in sideway. Sideway market is neither a bull nor a bear, but is more like a "buffalo", it is heavy and not moving. This is the typical movement in sideway market. Static. Fkli-nov shares almost the same fate as fcpo-feb, which both are in consolidation phase.
As the saying goes, "consolidation breeds advanced patterns". SO, here we are now, with a possible bearish bat pattern. The advanced pattern formed is however, different frm the fcpo. The kill-zone is formed in the range from 1535-1540, SL could be made 5-10pts abv it. 1st tp is at 1524 and 2nd tp 1512.5...Price has to breaks abv 1540-1560 resistance before showing any potential of reversal. That's all for tdy.
higher resistance : 1540-1560
immediate resistance : 1524
immediate support : 1512
critical support : 1480-1500 (decide full bear/sideway)
WARNING!
RISK DISCLAIMER : this is juz a trading idea...trading stocks, futures , crypto, commodities or forex might incur a huge risk to your account/funds… DON’T LOSE MONEY THAT YOU CANNOT AFFORD …any idea(s) of trading in this episode SHALL NOT be regarded as a hint of BUYING or SELLING . It is MERELY a trading journal and it has been used for educational purpose only… trade at your own risk!
**your "LIKE" and "FOLLOW" are my main source of motivation to continue posting more valuable contents...TQ*

KLCI may done muti-months correction. 12/Nov/211)On Charts : Charts consist of 3-Dimensions - The X-factor ( Time or Cycle ), The Y- factor ( Price Geometry ), AND The Z-factor ( The Speed ).. 2)On Elliot Wave / Market Structure : Unlike Textbook written rule : ALL Impulsive wave comprise of ONLY a-b-c sub-waves NOT 1,2,3,4,5 waves.. AND there is NO Truncated 5th wave BUT ONLY wrong wave counts...

FKLI TRADING : 307) bear has emergedthis is number 307...
the trend has reversed since 22nd OCt 2021. It has broken below the previous "higher-low" candlestick and therefore has reversed the trend.
SO now, the most practical trading strategy would be "short on rebound" until the change of the trend. After the short while of rebound, the market has shown "exhaustion" and now even daily chart is still in uptrend, the trend is in downtrend now and bear is in charge.
The closest support region ranging frm 1512-1524, with the critical low at 1506.The closest resistance range frm 1560-1580. Ever since the 1st nov 2021, a huge gap down has "bottled" the price into a tight range frm 1524-1544. Next level of support is 1512, then 1500, then 1480...this is a very critical support...
*plan your trade and trade your plan... gud luck*
immediate resistance : 1560-1580
immediate support : 1512-524
critical support : 1480-1500
WARNING!
RISK DISCLAIMER : this is juz a trading idea...trading stocks, futures , crypto, commodities or forex might incur a huge risk to your account/funds… DON’T LOSE MONEY THAT YOU CANNOT AFFORD …any idea(s) of trading in this episode SHALL NOT be regarded as a hint of BUYING or SELLING . It is MERELY a trading journal and it has been used for educational purpose only… trade at your own risk!
**your "LIKE" and "FOLLOW" are my main source of motivation to continue posting more valuable contents...TQ*

KLSE may resume downtrend @ ≈1555..2/Nov/21KLSE future index may resume its downtrend at around 1555 where this is the zone of ..1)Volume Profile's Valley ( Some traders only trade the "Peak" or "POC" of volume Profile. But the "valley" of Market profile could be "interpreted" as "Lesser" "Buyer or Seller". Depend on the "bias" of market sentiments overall trend 2)Closing the gap at round 1555 3) A minor Supply Zone (cyan) 4) A minor down trend line (yellow)

KLCI Plunged by 2.01% With Support Hold at 1520Malaysia slumped despite US markets gains as the proposed one-off prosperity tax and weighed market sentiment. However, the valuation of the local market remained attractive despite the Prosperity Tax compared to regional peers.
Market hit day low at 1523.5 and reached on the Major support level at 1520.
Stochastic level near to Oversold level at 30.00.
Pending for confirmation if market would rebound from the major support level or further declined to next Major Support level at 1500-1510?

KLCI what next after 33% affluent tax? 1/Nov/21KLCI future index is on its last leg to complete wave (E) ( Cyan /Light Blue).. The last leg of bullish contracting triangle correction. Price will rebound soon as price now close to :- 1) Volume Profile ( POC) ( Point of Control) at around 1517 AND 2) Daily Demand Zone (Cyan Rectangle Box).. 3) Dynamic cycle 4 ( cyan/light blue) reached soon 4) There is a selling Climax Signal from VSA ( Volume Spread Analysis ) on 4 hours Time Frame Chart ..

Will Futures Kuala Lumpur Index Bounce After Budget 2022?Technically speaking, market selling force remained strong despite Malaysia Budget 2022 having the highest allocation compared to previous budgets, the hurt of pandemic is relatively hard.
We shall say the Budget 2022 mainly for economic recovery and digitalization boosting.
Market likely to continue to move lower to test on the immediate support level at 1535, followed by 1510.
Maintain divergence view for FKLI, as stochastic signals downtrend signs.
While candlestick pattern shows Double Top at resistance level of 1600.
Downtrend signs remained strong, unless market starting to show rebound signs from support level at 1510 & 1535.

Oh! Futures Kuala Lumpur Index Marching to Support Level 1550?Profit taking activities and market lack of catalyst led market lower ahead of the announcement of Malaysia Budget 2022 by 29 Oct 2021.
Stochastic shows buying forces deteriorating.
Maintain short term correction view with immediate support level at 1550 and next support level at 1520.
Market may rebound after tomorrow announcement. We shall see market resume uptrend by next week.

FKLI Sideway Ahead of Malaysia Budget 2022, 29 Oct 2021?Market in muted mode, traders tend to stay sideline or reducing position in hand before announcement of Malaysia Budget 2022, by this Friday.
Stochastic shows market strength deteriorating, signalling stronger in selling force.
In short, market bullish view with immediate support at 1550, followed by 1520.

Another round for FKLI?MYX:FKLI1! could be headed for another round to the upside IF it manages to break above 1606. Keeping stops tight at 1602.5 with a target area of 1618.
Good luck.

KLCI Static vs Dynamic Cycle Analysis. 25/Oct/21Both Current KLCI index Price Dynamic Time Cycle No. 6 (cyan) AND Static Time Cycle (Red)(Dashed Curved Line) is pointing south.. Where the average low of the cycle will be due after 19 Nov 2021...

Futures Kuala Lumpur Index take a break?After recent rallied with the strength in plantation stocks and banking industries served support, market somehow touched on the resistance level at 1600-1620.
Profit taking activities likely to step in, with nearest support level at 1550-1565.
MACD showed divergence too. Who holding long position please take note, as market may have small correction after recent surged.
-market likely to move lower if market stays below 1605; target market range 1580-1605
-support level:
S1 1600 S2 1594 S3 1588
-resistance level:
R1 1610 R2 1616 R3 1622
-yesterday daily settlement: 1605.5
mid: 1605.8
strategy 1: Short if stay below 1600
tg stop 1606
tg exit 1582-1594
strategy 2: Long if stay above 1615
tg stop 1609
tg exit 1621-1633

FKLI headed higher on the 1HMYX:FKLI1! is looking to head higher IF it breaks and maintains above 1597.5 on the hourly. Targeting firstly 1608, and then 1614 thereabouts.
Good luck

FKLI TRADING : 305) full reversal of trend has happenedthis is number 305...
As what I have told frm the previous passage, the trend will reverse once the resistance of 1552.5-1563 has been breached. The momentum of uptrend continues on for fkli-oct and it closed abv the 1600 resistance tdy, 13th Oct 2021. It has turned into bull for both daily and hourly charts.
SO now, the most practical trading strategy would be "long on retracement" until the change of the trend. We are in recovery phase frm the fearful covid-19 pandemic therefore fkli is expected to rise to even higher region, 1655-1685, which could only be seen somewhere Dec last year to early this year.
the closest support region ranging frm 1580-1600 and the closest resistance range frm 1611-1631. hence, there is a high chance we might closing in the range abv 1600 and testing 1700 during the end of year window-dressing period. However, that is still too early to say. Hopefully, US and other big market dun catch us by surprise.
*plan your trade and trade your plan... gud luck*
higher resistance : 1655-1685
immediate resistance : 1611-1631
immediate support : 1580-1600
critical support : 1560
WARNING!
RISK DISCLAIMER : this is juz a trading idea...trading stocks, futures , crypto, commodities or forex might incur a huge risk to your account/funds… DON’T LOSE MONEY THAT YOU CANNOT AFFORD …any idea(s) of trading in this episode SHALL NOT be regarded as a hint of BUYING or SELLING . It is MERELY a trading journal and it has been used for educational purpose only… trade at your own risk!
**your "LIKE" and "FOLLOW" are my main source of motivation to continue posting more valuable contents...TQ*

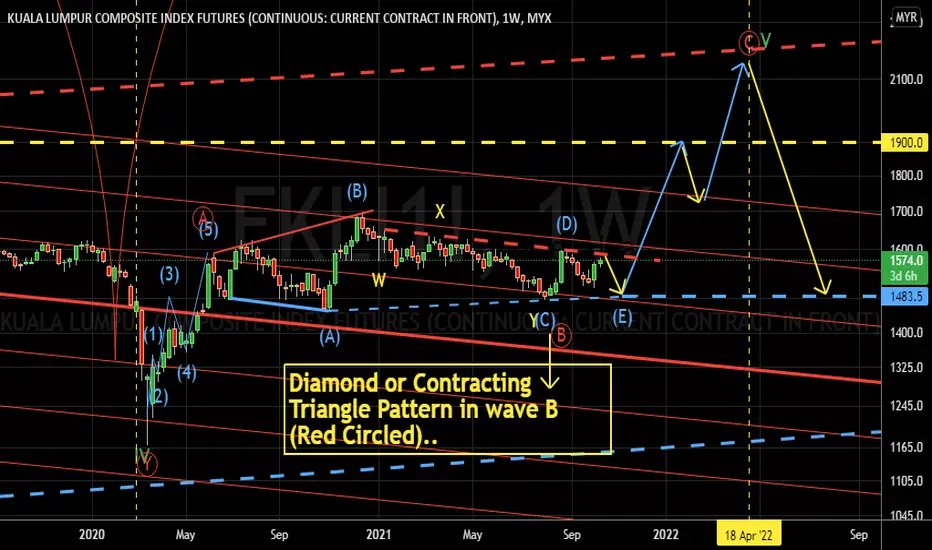
KLCI may form a diamond/contracting triangle. 12/Oct/21KLCI index price still in ranging and price may form a diamond/contracting triangle pattern before breakout for resuming uptrend..
FKLI TRADING : 303) downtrend oh donwtrendthis is number 303...
fkli-sept ended yesterday. Nothing much to report actually but it is still in downtrend for the fkli. It is downtrend and sideway as fkli-oct is more sensitive to the news events and market sentiment. Support is ranging frm 1513- 1524 and resistance frm 1552.5 - 1563.
IF the price breaks above the 1552.5-1563 resistance, THEN it will retest the 1580-1600 resistance. IF it falls below the 1513-1524 support level, THEN it will go to 1482-1497.
I am of the opinion that if the market still lacks any sentiment or "exciting" news, it will continue to slide and drop... as there is still much uncertainty and the market is still haunted by the ghoully effect of covid-19, it is still more doom and gloom than glory.
As in term of technical analyst, fkli-oct needs to break higher than 1552.5-1563 to reverse the downtrend and invites the bull home.
*plan your trade and trade your plan... gud luck*
higher resistance : 1580-1600
immediate resistance : 1552.5-1563
immediate support : 1513-1524
critical support : 1480-1500
WARNING!
RISK DISCLAIMER : this is juz a trading idea...trading stocks, futures , crypto, commodities or forex might incur a huge risk to your account/funds… DON’T LOSE MONEY THAT YOU CANNOT AFFORD …any idea(s) of trading in this episode SHALL NOT be regarded as a hint of BUYING or SELLING. It is MERELY a trading journal and it has been used for educational purpose only… trade at your own risk!
**your "LIKE" and "FOLLOW" are my main source of motivation to continue posting more valuable contents...TQ*

FKLI reached wave 3 Fibonacci 1.618Just finished corrective wave in Daily timeframe, broke up from downtrend channel ABC.
H4 Timeframe : impulse wave 1 and heading to wave 2 right now
I traded on impulse wave 3, looking for bullish trend soon !!!
This is Elliott Wave !

FKLI hourly has potential for a rebound after breakout to upsideFKLI1! has some potential for a counter-trend reversal to the upside if it manages to break above the 1524 level or if it stays stead above this area.
Targeting 1,544.5 in the short term.

KLCI 1515 is the "key" support. 20/9/21KLCI may found major support at around 1515 where there is a confluence zone of 1) trend line (yellow dotted) resistance/support flip zone 2) Major Demand Zone

FKLI hourly breaking support?The FKLI1! Index futures are looking to break its immediate 1543 support on the hourly timeframe to head lower targeting a low of 1525.
Drop a comment if you agree.
